Perinatal mortality: Trends in prevalence and association with birth weight
ORIGINAL RESEARCH ARTICLE
Perinatal mortality: Trends in prevalence and association with birth weight
Article Summary
- DOI: 10.24969/hvt.2025.581
- CARDIOVASCULAR DISEASES
- Published: 03/08/2025
- Received: 14/05/2025
- Revised: 10/07/2025
- Accepted: 11/07/2025
- Views: 4539
- Downloads: 2155
- Keywords: Birth weight of newborns, stillbirth rate, infant mortality, newborns, perinatal mortality, perinatal losses, late neonatal mortality, early neonatal mortality
Address for Correspondence: Violetta A. Vybornykh, Microdistrict 7, Building 14/1, Bishkek, 720028, Kyrgyzstan
E-mail: doctor-vybornyh@mail.ru Phone: +996 555325526
Violetta A. Vybornykh
Kyrgyz Scientific Center for Human Reproduction, Bishkek, Kyrgyz Republic
Abstract
Objective: Perinatal mortality is one of the key indicators of population health. Early neonatal mortality, being a component of perinatal mortality, reflects the quality of both obstetric and neonatal care through its level and structure. In this regard, the analysis of early neonatal losses is considered as a critical step in studying perinatal and infant mortality indicators. The aim of this study was to analyze perinatal mortality in order to assess early neonatal losses at the Kyrgyz Scientific Center for Human Reproduction.
Methods: A retrospective cohort and descriptive study of the dynamics of perinatal mortality was conducted based on medical records of newborns at the Kyrgyz Scientific Center for Human Reproduction from 2016 to 2023.
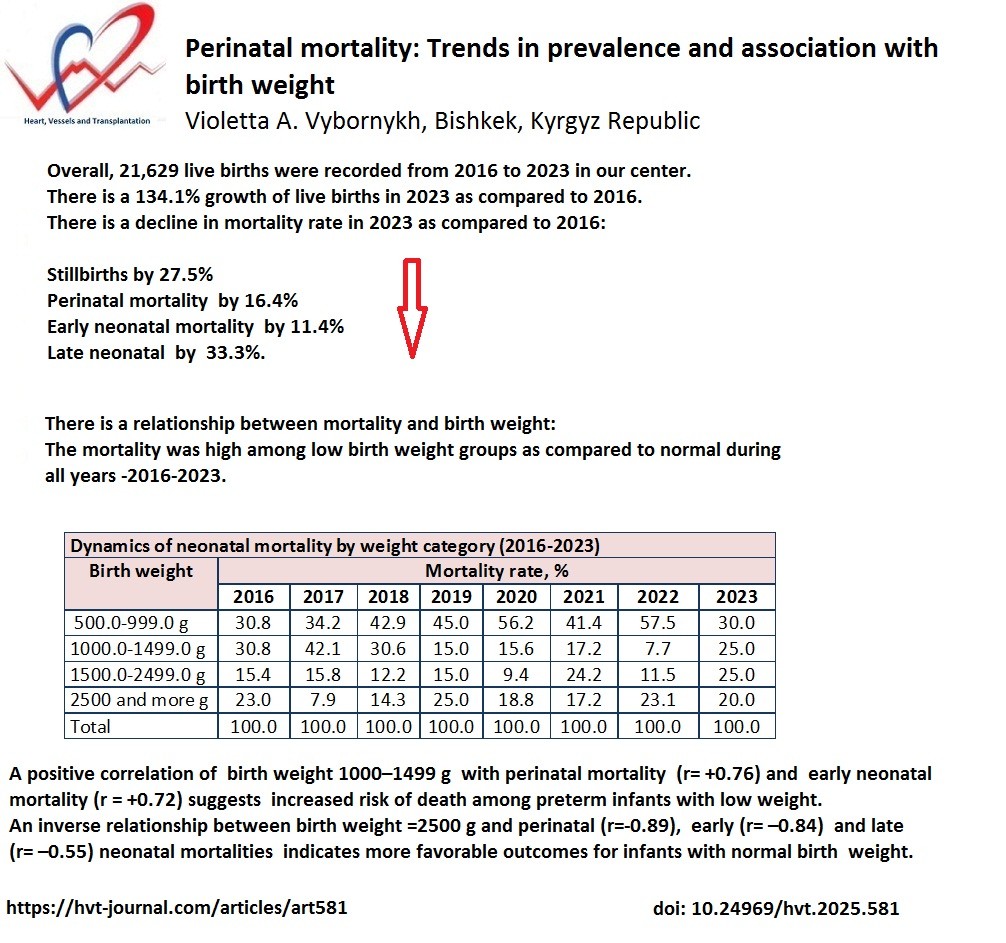
Results: The center recorded a general upward trend in the number of live births. Stillbirth rates showed a sharp increase in 2021; however, by 2023 they had decreased by 27.5% compared to 2016. The combined number of live and stillborn infants, used as an intermediate measure of perinatal losses, also demonstrated a wave-like trend. Early neonatal mortality remained relatively stable, from 8.8±0.7 per 1000 live births in 2016 to 7.8 (1.5) in 2023. The ratio between stillbirths and early neonatal deaths indicated an increase in early neonatal mortality relative to stillbirths. Late neonatal mortality declined by 33.4%. Overall, between 2016 and 2023, stillbirths decreased by 27.5%, early neonatal mortality by 11.4%, late neonatal mortality by 33.4%, and total perinatal mortality by 16.4%. The highest proportion of deaths due to low birth weight was observed in neonates weighing 500.0– 999.0 g and 1000.0–1499.0 g, particularly during the years 2018 to 2022.
Conclusion: The analysis of perinatal mortality at the Kyrgyz Scientific Center for Human Reproduction from 2016 to 2023 revealed a gradual decline in stillbirths, early, and late neonatal mortality, reflecting a positive trend in the organization of perinatal care. These findings highlight the need for continued improvement in prenatal diagnostics, antenatal monitoring, and neonatal care, particularly for high-risk groups, in alignment with WHO global priorities. Special emphasis should be placed on strengthening efforts aimed at achieving shared goals with the WHO: enhancing the capacity of the healthcare system during the perinatal period; improving the quality of care for mothers and newborns from pregnancy through the postpartum period; and advancing methods for monitoring, program implementation, and accurate registration of every newborn and every stillbirth.
Key words: Birth weight of newborns, stillbirth rate, infant mortality, newborns, perinatal mortality, perinatal losses, late neonatal mortality, early neonatal mortality.
Introduction
Perinatal mortality is naturally the most important indicator of population health (1-4). Perinatal mortality refers to the death of viable fetuses and newborns during the perinatal period (before 2004: from 28 weeks of gestation; since 2004: from 22 weeks of gestation to seven full days after birth). It includes the deaths of viable fetuses before the onset of labor or during delivery (stillbirths), as well as the deaths of newborns during the first week of life (early neonatal mortality).
Late neonatal mortality is defined as the death of infants occurring from the eighth through the 28th day of life within a calendar year, expressed per 1000 live births in the same year. Before 2004, a live birth was defined as the complete expulsion or extraction of a fetus from the mother's body at 28 weeks of gestation or more (i.e., a fetus measuring at least 35 cm in length and weighing at least 1000 g) that showed evidence of life, such as breathing. Fetuses born before 28 weeks of gestation (less than 35 cm and less than 1000 g) who survived beyond 7 days (i.e., past the perinatal period) were also considered live births resulting from preterm delivery. A stillbirth was defined as the expulsion or extraction of a fetus from the mother's body that showed no signs of life (i.e., did not breathe) after separation from the maternal organism (5).
Early neonatal mortality is a constituent part of perinatal mortality, the level and structure of which reflects the quality of both obstetric and neonatal care (6). In this regard, the analysis of early neonatal losses is considered the most important stage in the study of perinatal and infant mortality rates (7).
According to WHO, the greatest risk of death threatens children in the first month of their life: 2.3 million newborns died in 2022. Neonatal mortality has decreased by 44% since 2000. Nevertheless, in 2022, almost half (47%) of all deaths of children under the age of five occur precisely in the neonatal period (the first 28 days of life), which belongs to the most vulnerable periods of life and requires enhanced provision of high-quality intranatal care and care for newborns (8). Although overall perinatal mortality rates are declining in high-income countries, there is a slower rate of decline in stillbirths. In high-income countries, antenatal stillbirth accounts for a large proportion of total stillbirths (9). Despite the recent rise in perinatal mortality rates in the UK, stillbirth and neonatal mortality rates in 2021 were nevertheless 19% and 30% lower than in 2010. Low-income countries continue to have higher neonatal mortality rates (10). In Ethiopia's Samali, out of 765 live births, 99 deaths occurred within the first 7 days (11). According to Global Burden of Disease 2015, global average early neonatal mortality rates in 2012-2015 were 15.52-14.79 per 1,000 live births (12).
The continued high risk of neonatal mortality dictates the need to strengthen prenatal diagnosis and improve the quality of intranatal care. The Kyrgyz Scientific Center for Human Reproductive Health, under the Ministry of Health of the Kyrgyz Republic, is a tertiary-level specialized medical institution providing high-tech healthcare services in the field of reproductive medicine using modern diagnostic and therapeutic methods.
The aim of this study was to analyze perinatal mortality in order to assess early neonatal losses at the Kyrgyz Scientific Center for Human Reproduction.
Methods
Study design and population
A retrospective cohort study of perinatal mortality was conducted at the Kyrgyz Scientific Center for Human Reproduction based on neonatal medical records from 2016 to 2023. The analysis was based on archival data reflecting the number of registered live births. The center is a tertiary-level specialized medical institution providing high-tech reproductive health care.
The study included newborns with a gestational age of 22 weeks or more, in accordance with modern criteria for the perinatal period. To assess the degree of maturity and risk of perinatal losses, stratification was performed based on birth weight, which indirectly reflects gestational age. The following groups were identified: newborns weighing less than 1000 g (presumed gestational age <28 weeks), 1000–1499 g (28–31 weeks), 1500–2499 g (32–36 weeks), and =2500 g (=37 weeks). This approach made it possible to analyze outcomes across varying degrees of prematurity and fetal maturity within a unified framework of perinatal monitoring.
We analyzed 21,629 live births record for a period of 2016-2023. The dataset included cases of stillbirths, early neonatal mortality (0–6 days), and late neonatal mortality (7–27 days).
Inclusion criteria:
- Newborns delivered at the Kyrgyz Scientific Center for Human Reproduction from 2016 to 2023;
- Cases of perinatal mortality, including antenatal and intrapartum stillbirths; early neonatal deaths (0–6 days); and late neonatal deaths (7–27 days);
- Newborns of various birth weights (<1000 g, 1000–1499 g, =2500 g) and gestational ages.
Exclusion criteria: Cases in which newborns were transferred to other healthcare facilities for second-stage care and where reliable information on clinical course and outcome was not available.
All mothers provided informed consent for procedures upon admission to the hospital. Due retrospective nature of the study, the approval of Ethics Committee was not required.
Study variables
We evaluated age and sex of newborns, birth weight, number of stillbirths and live births, s causes of death (congenital malformations, intrauterine infection, hyaline membrane diseases), perinatal mortality (combined stillbirth and death with 1 week after birth), early neonatal mortality (0–6 days), and late neonatal mortality (7–27 days).
The study included the calculation of relative indicators (mortality percentage, mortality rate per 1000 of live births, structure indicators, visual score), time series analysis (absolute and relative changes, growth and decline rates).
Statistical analysis
Statistical analysis included Student’s t-test for statistical significance, and reliability levels: p < 0.05 (less than 95% confidence), p < 0.01 (99% confidence), and p < 0.001 (99.9% confidence). The correlation between perinatal mortality and birth weight over time was evaluated using Spearman’s rank correlation method.
Results
Out of a total of 21,629 live births recorded from 2016 to 2023, 11,023 (50.98%) were male and 10,606 (49.02%) were female. Newborns with a birth weight of =2500 g accounted for 75.0%, while preterm infants (<2500 g) made up 25%. The average gestational age was 33 weeks.
The number of live births by year was as follows: 2016 – 1475; 2017 – 2191; 2018 – 2634; 2019 – 2243; 2020 – 2831; 2021 – 3571; 2022 – 3231; 2023 – 3453. The number of stillbirths by year was: 2016 – 6; 2017 – 28; 2018 – 14; 2019 – 11; 2020 – 10; 2021 – 19; 2022 – 12; 2023 – 10.
From 2016 to 2023, there was a general upward trend in the absolute number of live births (Table 1). In 2016, 1475 newborns were delivered alive. In 2017, the number increased by 48.5% (n=2191), followed by another rise of 20.2% in 2018 (n=2634). In 2019, a decline of 14.8% was observed (n=2243). In subsequent years, the number of live births increased sharply: 2831 in 2020, 3571 in 2021, 3231 in 2022, and 3453 in 2023. The growth rate was +26.2% in 2020, +26.1% in 2021, and +6.8% in 2023, while a decrease of 9.5% was noted in 2022 despite a high number of live births. By 2023, the visual indicator increased to 234.1% compared to 2016, reflecting a 134.1% growth.
The combined number of live and stillborn infants, used as an intermediate indicator of perinatal losses, also followed a wave-like trend. In 2016, this number was 1481, rising by 49.8% in 2017. Subsequent increases were observed in 2018 (+19.3%), 2020 (+26.0%), 2021 (+26.3%), and 2023 (+6.4%). Declines occurred in 2019 (–14.8%) and 2022 (–9.6%). By 2023, the visual indicator reached 233.1%, indicating a 133.1% increase compared to 2016.
Stillbirth rates showed a fluctuating pattern. In 2016, the stillbirth rate was 4.0 (1.6) per 100 births (n=6). In 2017, it increased more than threefold by 215.0% (12.6 (2.3), n=28; p<0.001). In 2018, the rate decreased by 58.7% to 5.2 (1.3) (n=14; p<0.001). In 2019, it declined slightly by 5.8% to 4.9 (1.4) (n=11; p>0.05). In 2020, the rate dropped by another 28.5% to 3.5 (1.1) (n=10; p>0.05). The highest rate during the 3-year period from 2021 to 2023 was in 2021, with an increase of 51.4% (5.3 (1.2), n=19; p>0.05) compared to 2020. In 2022, stillbirths decreased by 30.2% (3.7 (1.0), n=12; p>0.05), and in 2023, a further 21.6% decline was recorded (2.9 (0.9), n=10; p>0.05). The visual indicator of stillbirths dropped to 72.5% in 2023 compared to 2016, representing a 27.5% reduction.
The Kyrgyz Scientific Center for Human Reproduction recorded the highest levels of early neonatal mortality (0–6 days) (Tables 1, 2), primarily due to its tertiary-level status and the referral of high-risk pregnancies from regional facilities. In 2016, the early neonatal mortality rate was 8.8 (0.7) per 1000 live births (n=13). In 2017, this rate nearly doubled, increasing by 86.3% to 16.4 (0.7) (n=36), p<0.001. In 2018, the rate remained nearly unchanged at 16.7 (0.7) (n=44), with a minor increase of 1.8%, p>0.05. A sharp decline occurred in 2019, with a decrease of 52.1% to 8.0 (0.5) (n=18), p<0.001. In 2020, the rate rose again to 10.2 (0.5) (n=29), an increase of 27.5%. From 2021 to 2023, the values stabilized: 8.1 (1.5) (n=29) in 2021, 8.0 (1.5) (n=26) in 2022, and 7.8 (1.5) (n=27) in 2023. The rate declined by 20.6% in 2021, rose by 6.6% in 2022, and decreased by 2.5% in 2023. The overall visual indicator for 2023 was 88.6%, reflecting an 11.4% reduction in early neonatal deaths compared to 2016.
Mortality during the late neonatal period (7–27 days) showed slight fluctuations from 2017 to 2023. No cases were recorded in 2016. In 2017, there were two deaths (0.9 (0.2)), with no relative change. In 2018, mortality rose 2.1 times to 1.9 (0.2) (n=5), a 111.1% increase, p<0.001. In 2019, it dropped by 57.9% to 0.8 (0.1) (n=2), p<0.001. The rate increased by 25.0% in 2020 (1.0 (0.1), n=3), by 10.0% in 2021 (1.1 (0.5), n=4), then sharply declined by 72.7% in 2022 (0.3 (0.3), n=1), p>0.05. In 2023, it rose again by 100.0% to 0.6 (0.4) (n=2). Despite year-to-year variability, the visual indicator for 2023 was 66.6%, indicating a 33.3% decline in late neonatal mortality compared to 2016.
Perinatal mortality among newborns without congenital anomalies was elevated in 2017 and 2018, while remaining relatively stable in 2016, 2019, 2020, and 2021, with notable declines in 2022 and 2023. In 2016, perinatal mortality, which included stillbirths and deaths within the first week, was 12.8 (0.8) (n=19).
This rose sharply in 2017 to 28.8 (0.9) (n=64), an increase of 125.0%, p>0.05. In 2018, a decline of 23.9% occurred (21.9 (1.0), n=58), p>0.05. From 2019 to 2023, rates were relatively stable: 12.9 (0.7) (n=29) in 2019 (–41.1%); 13.7 (0.6) (n=39) in 2020 (+6.2%); 13.3 (0.5) (n=48) in 2021 (–2.9%); 11.7 (0.5) (n=38) in 2022 (–12.0%, p<0.01); and 10.7 (1.7) (n=37) in 2023 (– 8.5%, p>0.05). The visual indicator in 2023 reached 83.6%, reflecting a 16.4% reduction in perinatal mortality compared to 2016.
The analysis of neonatal mortality by birth weight (Table 3) showed that infants weighing 500.0–999.0 g accounted for 30.8% (n=4) of neonatal deaths in 2016. In subsequent years, their proportion increased: 34.2% (n=13) in 2017, 42.9% (n=21) in 2018, 45.0% (n=9) in 2019, and peaked at 56.2% (n=18) in 2020. The rate decreased to 41.4% (n=12) in 2021, rose again to 57.5% (n=15) in 2022, and declined sharply to 30.0% (n=6) in 2023. The growth rates were: +11.0% in 2017, +25.4% in 2018, +4.9% in 2019, and +24.9% in 2020. Decreases occurred in 2021 (–26.3%) and 2023 (–47.8%), with an increase in 2022 (+38.9%).
Mortality among newborns with a birth weight of 1000.0–1499.0 g also showed a wave-like pattern. In 2016, the proportion was 30.8% (n=4); it rose to 42.1% (n=16) in 2017, then decreased to 30.6% (n=15) in 2018, 15.0% (n=3) in 2019, and 15.6% (n=5) in 2020. A slight increase was observed in 2021 (17.2%, n=5), followed by a drop to 7.7% (n=2) in 2022 and a sharp rise to 25.0% (n=5) in 2023. Significant growth was noted in 2017 (+36.7%), 2020 (+4.0%), 2021 (+10.2%), and especially in 2023 (+224.6%), while substantial decreases occurred in 2018 (–27.3%), 2019 (–51.0%), and 2022 (–55.2%).
For infants weighing 1500.0–2499.0 g, the proportion of deaths remained relatively stable from 2016 to 2019: 15.4% (n=2), 15.8% (n=6), 12.2% (n=6), and 15.0% (n=3), respectively. In 2020, the rate dropped to 9.4% (n=3), but then rose significantly in 2021 (24.2%, n=7) and 2023 (25.0%, n=5), with a slight decline in 2022 (11.5%, n=3). Notable increases were seen in 2017 (+2.6%), 2019 (+22.9%), 2021 (+157.4%), and 2023 (+117.4%), while decreases occurred in 2018 (–22.7%), 2020 (–37.3%), and 2022 (–52.4%).
Mortality among newborns weighing =2500 g was relatively high in 2016 (23.0%), 2019 (25.0%, n=5), and 2020 (18.8%, n=6). The rates were lower in 2017 (7.9%, n=3) and 2018 (14.3%, n=7), but rose again from 2019 onward: 25.0% (n=5) in 2019, 18.8% (n=6) in 2020, 17.2% (n=5) in 2021, 23.1% (n=6) in 2022, and 20.0% (n=4) in 2023. Decreases were noted in 2017 (–65.6%), 2020 (–24.8%), 2021 (–8.5%), and 2023 (–13.4%). Increases occurred in 2018 (+81.0%), 2019 (+74.8%), and 2022 (+34.5%). Despite moderate proportions, the rate of increase remained high in the 1500.0– 2499.0 g and =2500 g categories.
A correlation analysis of perinatal mortality over time in relation to birth weight revealed a strong inverse relationship between perinatal mortality (rxy = –0.89) and early neonatal mortality (rxy = –0.84) and birth weight =2500 g, indicating more favorable outcomes for infants with normal birth weight. A positive correlation was found for birth weight 1000–1499 g (rxy = +0.76 and rxy = +0.72, respectively), suggesting increased risk among preterm infants. Late neonatal mortality showed a moderate inverse correlation with birth weight =2500 g (rxy = –0.55), further emphasizing the prognostic value of birth weight during the neonatal period.
Discussion
In the Kyrgyz Scientific Center for Human Reproduction, a general trend of increasing live births was observed. Stillbirth rates showed a sharp rise in 2021; however, by 2023, stillbirths had decreased by 27.5% compared to 2016. Early neonatal mortality significantly increased in 2017–2018 and 2020, while remaining relatively stable in other years - from 8.8 (0.7) per 1,000 live births in 2016 to 7.8 (1.5) in 2023. The ratio of stillbirths to early neonatal deaths indicated a relative increase in early neonatal mortality. Late neonatal mortality remained low, with peaks in 2018 and 2021, and showed a 33.4% decrease in 2023 compared to 2016.
Perinatal losses were highest in 2017–2018, but a decline in perinatal mortality was recorded by 2023. Between 2016 and 2023, stillbirths decreased by 27.5%, early neonatal mortality by 11.4%, late neonatal mortality by 33.4%, and overall perinatal mortality by 16.4%.
Our results on dynamics of mortality in newborns are in agreement with previous studies (9-11). We contributed to the evidence by demonstrating the association of mortality in newborns with birth weight. The highest share of neonatal deaths was associated with low birth weight, particularly in the 500.0–999.0 g and 1000.0–1499.0 g categories, especially during 2018–2022.
|
Table 1. Perinatal neonatal mortality at the Kyrgyz Scientific Center for Human Reproduction of the Ministry of Health of the Kyrgyz Republic over time (2016-2023) |
||||||||||||||||||
|
№ n/n |
Indicator |
Years |
VS (%) |
|||||||||||||||
|
2016 |
2017 |
2018 |
2019 |
2020 |
2021 |
2022 |
2023 |
|||||||||||
|
n |
R1000 (SE) |
n |
R1000 (SE) |
n |
R1000 (SE) |
n |
R1000 (SE) |
n |
R1000 (SE) |
n |
R1000 (SE) |
n |
R1000 (SE) |
n |
R1000 (SE) |
|||
|
1 |
Born alive |
1475 |
- |
2191 |
- |
2634 |
- |
2243 |
- |
2831 |
- |
3571 |
- |
3231 |
- |
3453 |
- |
234.1 |
|
Growth rate, % |
- |
- |
- |
+48.5 |
- |
+20.2 |
- |
-14.8 |
- |
+26.1 |
- |
+26.1 |
- |
-9.5 |
- |
+6.8 |
|
|
|
2 |
Born alive and dead |
1481 |
- |
2219 |
- |
2648 |
- |
2254 |
- |
2841 |
- |
3590 |
- |
3243 |
- |
3453 |
- |
233.1 |
|
Growth rate , % |
- |
- |
- |
+49.8 |
- |
+19.3 |
- |
-14.8 |
- |
+26.0 |
- |
+26.3 |
- |
-9.6 |
- |
+6.4 |
|
|
|
3 |
Mortinatus |
6 |
4.0 (1.6) |
28 |
12.6 (2.3) |
14 |
5.2 (1.3) |
11 |
4.9 (1.4) |
10 |
3.5 (1.1) |
19 |
5.3 (1.2) |
12 |
3.7 (1.0) |
10 |
2.9 (0.9) |
72.5 |
|
Growth rate , % |
- |
- |
- |
+215.0 |
- |
-58.7 |
- |
-5.8 |
- |
-28.5 |
- |
+51.4 |
- |
-30.2 |
- |
-21.6 |
|
|
|
4 |
Died in early neonatal age (0-6 days) |
13 |
8.8 (0.7) |
36 |
16.4 (0.7) |
44 |
16.7 (0.7) |
18 |
8.0 (0.5) |
29 |
10.2 (0.5) |
29 |
8.1 (1.5) |
26 |
8.0 (1.5) |
27 |
7.8 (1.5) |
88.6 |
|
Growth rate , % |
- |
- |
- |
+86.3 |
- |
+1.8 |
- |
-52.1 |
- |
+27.5 |
- |
-20.6 |
- |
-1.2 |
- |
-2.5 |
|
|
|
5 |
Died in late neonatal age (7-27 days) |
- |
- |
2 |
0.9 (0.2) |
5 |
1.9 (0.2) |
2 |
0.8 (0.1) |
3 |
1.0 (0.1) |
4 |
1.1 (0.5) |
1 |
0.3 (0.3) |
2 |
0.6 (0.4) |
66.6 |
|
Growth rate , % |
- |
- |
- |
0 |
- |
+111.1 |
- |
-57.9 |
- |
+25.0 |
- |
+10.0 |
- |
-72.7 |
- |
+100.0 |
|
|
|
6 |
Perinatal mortality (without congenital malformation) |
19 |
12.8 (0.8) |
64 |
28.8 (0.9) |
58 |
21.9 (1.0) |
29 |
12.9 (0.7) |
39 |
13.7 (0.6) |
48 |
13.3 (0.5) |
38 |
11.7 (0.5) |
37 |
10.7 (1.7) |
83.6 |
|
Growth rate , % |
- |
- |
- |
+125.0 |
- |
-23.9 |
- |
-41.1 |
- |
+6.2 |
- |
-2.9 |
- |
-12.0 |
- |
-8.5 |
|
|
|
Data are presented as n - absolute number, % - percentage, R1000 (SE) – mortality rate per 1000 newborns (standard error),VS – visual score
|
||||||||||||||||||
|
Table 2. Leading causes of neonatal death (2016-2023)
|
|||||||||||||||||
|
№ n/n |
Indicator |
Years |
|||||||||||||||
|
2016 |
2017 |
2018 |
2019 |
2020 |
2021 |
2022 |
2023 |
||||||||||
|
n |
R1000 (SE) |
n |
R1000 (SE) |
n |
R1000 (SE) |
n |
R1000 (SE) |
n |
R1000 (SE) |
n |
R1000 (SE) |
n |
R1000 (SE) |
n |
R1000 (SE) |
||
|
1 |
Congenital malformations |
2 |
15.4 (10.0) |
25 |
65.8 (8.6) |
30 |
61.2 (6.9) |
6 |
30.0 (10.2) |
11 |
34.4 (8.3) |
8 |
24.2 (7.4) |
13 |
48.1 (9.6) |
13 |
44.8 (9.2) |
|
2 |
Intrauterine infection |
2 |
15.4 (10.0) |
7 |
18.4 (6.2) |
5 |
10.2 (4.3) |
4 |
20.0 (8.9) |
3 |
9.4 (5.1) |
6 |
18.1 (6.7) |
5 |
18.5 (7.4) |
4 |
13.8 (6.4) |
|
3 |
Hyaline membrane disease |
6 |
46.1 (13.8) |
5 |
13.1 (5.4) |
12 |
24.5 (6.1) |
9 |
45.0 (11.1) |
18 |
56.2 (8.7) |
19 |
57.5 (8.6) |
9 |
33.3 (9.0 |
12 |
41.3 (9.1) |
|
4 |
Early neonatal mortality |
13 |
8.8 (0.7) |
36 |
16.4 (0.7) |
44 |
16.7 (0.7) |
18 |
8.0 (0.5) |
29 |
10.2 (0.5) |
27 |
7.5 (1.4) |
26 |
8.0 (1.5) |
29 |
8.4 (1.5) |
|
5 |
Late neonatal mortality |
- |
- |
2 |
0.9 (0.2) |
5 |
1.9 (0.2) |
2 |
0.8 (0.1) |
3 |
1.0 (0.1) |
2 |
0.5 (0.3) |
1 |
0.3 (0.3) |
4 |
1.1 (0.5) |
|
Data are presented as n - absolute number. R1000 (SE) – mortality rate per 1000 newborns (standard error) |
|||||||||||||||||
|
Table 3.Dynamics of neonatal mortality by weight category (2016-2023) |
|||||||||||||||||
|
№ n/n |
Body weight |
Years |
|||||||||||||||
|
2016 |
2017 |
2018 |
2019 |
2020 |
2021 |
2022 |
2023 |
||||||||||
|
n |
% |
n |
% |
n |
% |
n |
% |
n |
% |
n |
% |
n |
% |
n |
% |
||
|
1 |
500.0-999.0 |
4 |
30.8 |
13 |
34.2 |
21 |
42.9 |
9 |
45.0 |
18 |
56.2 |
12 |
41.4 |
15 |
57.5 |
6 |
30.0 |
|
2 |
1000.0-1499.0 |
4 |
30.8 |
16 |
42.1 |
15 |
30.6 |
3 |
15.0 |
5 |
15.6 |
5 |
17.2 |
2 |
7.7 |
5 |
25.0 |
|
3 |
1500.0-2499.0 |
2 |
15.4 |
6 |
15.8 |
6 |
12.2 |
3 |
15.0 |
3 |
9.4 |
7 |
24.2 |
3 |
11.5 |
5 |
25.0 |
|
4 |
2500 and more |
3 |
23.0 |
3 |
7.9 |
7 |
14.3 |
5 |
25.0 |
6 |
18.8 |
5 |
17.2 |
6 |
23.1 |
4 |
20.0 |
|
|
Total |
13 |
100.0 |
38 |
100.0 |
49 |
100.0 |
20 |
100.0 |
32 |
100.0 |
29 |
100.0 |
26 |
100.0 |
20 |
100.0 |
|
Data are presented as n - absolute number. % of total number of cases |
|||||||||||||||||
Correlation analysis revealed a strong inverse relationship between normal birth weight and both perinatal and early neonatal mortality, meaning full-term infants had favorable outcomes. Though weaker, correlation of normal birth weight with low rate of late neonatal mortality demonstrated that birth weight had prognostic significance in late neonatal period too. Conversely, a positive correlation with birth weight 1000–1499 g and increased perinatal and early neonatal mortality rates indicate increased risk of death among preterm infants.
It is crucial to widely implement perinatal audit, as recommended by the Ministry of Health of the Kyrgyz Republic under the “Strengthening Maternal and Child Health Systems” project, for systematic quality assessment of perinatal care, identification of causes of neonatal deaths and stillbirths, and analysis of contributing factors.
Study limitations
The main limitation of the study is its` retrospective design. Another potential; limitation is that it is a signle –center study. Further prospective multicenter studies should be warranted to evaluate the factors associated with mortality in newborns.
Conclusion
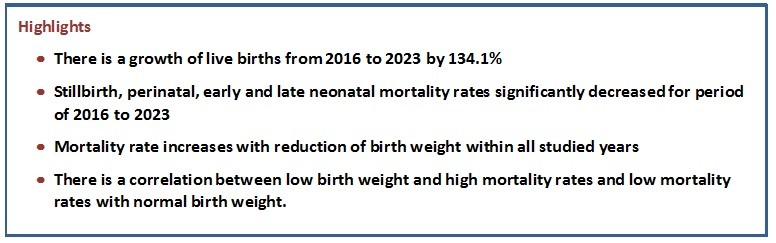
There is a growth of live births and reduction of stillbirth, perinatal, early and late neonatal mortality rates for period of 2016 to 2023.
The analysis of perinatal mortality at the Kyrgyz Scientific Center for Human Reproduction from 2016 to 2023 revealed a gradual decline in stillbirths, early, and late neonatal mortality, reflecting a positive trend in the organization of perinatal care. However, mortality rate increases with reduction of birth weight within all studied years. There is a positive correlation between low birth weight and mortality rates.
These findings highlight the need for continued improvement in prenatal diagnostics, antenatal monitoring, and neonatal care, particularly for high-risk groups, in alignment with WHO global priorities.
Special emphasis should be placed on strengthening efforts aimed at achieving shared goals with the WHO: enhancing the capacity of the healthcare system during the perinatal period; improving the quality of care for mothers and newborns from pregnancy through the postpartum period; and advancing methods for monitoring, program implementation, and accurate registration of every newborn and every stillbirth.
Ethics: All mothers provided informed consent for procedures upon admission to the hospital. Due retrospective nature of the study, the approval of Ethics Committee was not required.
Peer-review: External and internal
Conflict-of-interest: None to declare
Authorship: V.V.A. drafted the manuscript and fulfilled the criteria for authorship. The author approved the final version of the article before publication and agreed to be responsible for all aspects of the work, implying proper study and resolution of issues related to the accuracy or integrity of any part of the work.
Acknowledgement and Funding: None to declare
Statement on A.I.-assisted technologies use: The author did not use AI technology in preparing the manuscript
Availability of data and materials: Not applicable
References
| 1. Starodubov VI, Suhanova LP, Sychenkov JuG. Reproductive losses as a medical and social problem of the demographic development of Russia. Soc Aspects Popul Health 2011; 6: 1. | ||||
| 2. Jakovleva TV. Causes and dynamics of perinatal mortality in the Russian Federation. Health care of the Russian Federation 2005; 4: 34-8. | ||||
| 3. Shhegolev AI, Tumanova UN, Shuvalova MP, Frolova OG. Regional features of perinatal mortality from congenital anomalies in the Russian Federation. Mod Prob Sci Educ 2015; 4. Available from: URL: https://science-education.ru/ru/article/view?id=21259 | ||||
| 4. Gage AD, Fink G, Ataguba JE, Kruk ME. Hospital delivery and neonatal mortality in 37 countries in sub-Saharan Africa and South Asia: An ecological study. PLoS Med 2021; 18: e1003843. https://doi.org/10.1371/journal.pmed.1003843 PMid:34851947 PMCid:PMC8635398 |
||||
| 5. Demographic Yearbook of the Kyrgyz Republic, 2019-2023. Bishkek: National Statistical Committee of the Kyrgyz Republic. 2024. 310. | ||||
| 6. Suhanova LP, Skljar MS. Child and perinatal mortality in Russia: trends, structure, risk factors. Soc Aspects Popul Health 2008. Available from: URL: http://vestnik.mednet.ru/content/view/46/63 | ||||
| 7. Andrijanycheva NV, Simahodskij AS. Current trends in infant mortality and perinatal losses in St. Petersburg. Quest Modern Pediatr 2013; 12: 5-7. https://doi.org/10.15690/vsp.v12i5.791 |
||||
| 8. WHO. Neonatal mortality. 2024. Available from: URL: https://www.who.int/ru/news-room/fact-sheets/detail/newborn-mortality | ||||
| 9. Winsloe C, Pasupathy D. Understanding perinatal mortality. Obstet Gynaecol Reprod Med2024; 34: 1-5. https://doi.org/10.1016/j.ogrm.2023.10.001 |
||||
| 10. Armstrong CE, Magoma M, Ronsmans C. Magnitude of maternal and neonatal mortality in Tanzania: A systematic review. Int J Gynecol Obstet 2015; 130: 98-110. doi: 10.1016/j.ijgo.2015.04.021 https://doi.org/10.1016/j.ijgo.2015.04.021 PMid:25979118 |
||||
| 11. Ahmed AT, Farah AE, Ali HN, Ibrahim MO. Determinants of early neonatal mortality (hospital based retrospective cohort study in Somali region of Ethiopia). Sci Rep 2023; 13: 1114. doi: 10.1038/s41598-023-28357-x https://doi.org/10.1038/s41598-023-28357-x PMid:36670231 PMCid:PMC9859816 |
||||
| 12. Reddy KS. Global Burden of Disease Study 2015 provides GPS for global health 2030. Lancet 2016; 388: 144 https://doi.org/10.1016/S0140-6736(16)31743-3 PMid:27733278 |
||||
Copyright

This work is licensed under a Creative Commons Attribution-NonCommercial 4.0 International License.
AUTHOR'S CORNER
