Analysis of the rationality of drug procurement in a cardiology hospital using the ABC-VEN matrix method: Results of an observational study
ORIGINAL RESEARCH ARTICLE
Analysis of the rationality of drug procurement in a cardiology hospital using the ABC-VEN matrix method: Results of an observational study
Article Summary
- DOI: 10.24969/hvt.2025.607
- CARDIOVASCULAR DISEASES
- Published: 18/11/2025
- Received: 28/08/2025
- Revised: 13/10/2025
- Accepted: 14/10/2025
- Views: 2063
- Downloads: 1354
- Keywords: Cost analysis, procurement rationality, medicines, cardiology profile, hospital, ABC–VEN matrix analysis
Address for Correspondence: Ainura T. Sharaeva, Department of Basic and Clinical Pharmacology, Kyrgyz-Russian Slavic University named after the First President of the Russian Federation B.N. Yeltsin, Bishkek, Kyrgyzstan
E-mail: sharaevaainur@yandex.com
ORCID: Ainura T. Sharaeva - 0000-0003-0955-095X; Aida A. Zurdinova - 0000-0002-7093-981X
Facebook: Ainura T. Sharaeva - ruslan.alimov.5621
Ainura T. Sharaeva, Aida A. Zurdinova
Department of Basic and Clinical Pharmacology, Kyrgyz-Russian Slavic University named after the First President of the Russian Federation B.N. Yeltsin, Bishkek, Kyrgyzstan
Abstract
Objective: This article presents an ABC–VEN matrix analysis of medicines used in a cardiology healthcare organization in the Kyrgyz Republic for the period 2021–2024, with an assessment of expenditure structure by categories (I, II, III).
Methods: A retrospective analysis of drug procurement was conducted using ABC and VEN analytical methods. The evaluation was performed according to the share of expenditures and clinical significance, based on the National List of Essential Medicines of the Kyrgyz Republic (NLEM KR). Statistical analyses were carried out using Microsoft Excel and IBM SPSS Statistics 26.0.
Results: The analysis of procurement rationality revealed significant differences in expenditure distribution across categories I, II, and III. According to the data from 2021–2024, the average expenditures in category I substantially exceeded those in categories II and III. The mean expenditure in category I exceeded 26 million KGS, whereas category II accounted for approximately 0.8 million KGS, and category III for less than 50 thousand KGS. The greatest budget burden was observed in category I, with statistically significant differences between categories I and II, as well as I and III (p<0.01). Significant differences were also noted between categories II and III (p<0.05). These findings indicate that the expenditure structure is mainly driven by the high-cost group I, while categories II and III play a relatively smaller role.
To assess differences in expenditures among the three independent groups (categories I, II, and III), the nonparametric Kruskal–Wallis H-test was applied, yielding the following result: H=9.85, p=0.0073. Thus, the differences in expenditures among the categories were statistically significant (p<0.05).
Conclusion: The obtained results confirm the effectiveness of the ABC–VEN analysis for optimizing the structure of drug procurement and prioritizing medicines in real clinical practice under limited healthcare resources.
Key words: Cost analysis, procurement rationality, medicines, cardiology profile, hospital, ABC–VEN matrix analysis
Graphical abstract
Introduction
Irrational use and inadequate control of medicine inventories can contribute to inefficiency within the healthcare system and lead to the irrational use of limited healthcare resources, thereby increasing overall healthcare expenditures. This issue is of great importance in the real healthcare practice of our republic. In recent years, the control of drug expenditures has drawn considerable attention from hospital administrators and researchers. Within the framework of a limited healthcare budget, implementing rational drug use and effective pharmaceutical management strategies can reduce resource wastage and ensure that a greater number of patients receive appropriate care.
A WHO report indicated that in most countries, overall healthcare expenditures are growing faster than the economy; however, in low- and middle-income countries (LMICs), the growth is more rapid than in high-income countries — 6% versus 4% (1). The share of drug expenditures in total healthcare spending in developing countries ranges from 7.7% to 67.6% (2). Therefore, healthcare professionals in LMICs aim to implement sustainable, efficient, and rational approaches to curb the rise in healthcare costs (3).The ABC analysis is one of the most effective tools for financial management, based on the Pareto principle, according to which 80% of the total cost comes from 20% of the items (4). The ABC analysis is used to assess data on drug consumption over a period of one year or less (5). It classifies pharmaceutical products into three categories:
• Category A: 10–20% of the items account for 70–80% of the total cost;
• Category B: 10–20% of the items account for 15–20% of the total cost;
• Category C: 60–80% of the items account for only 5–10% of the total cost (6).
Items in Category A require daily monitoring, those in Category B require periodic monitoring, and items in Category C require infrequent control (7The VEN analysis is a method that helps determine the priority for drug procurement and storage. Medicines are classified according to their impact on health as Vital (V), Essential (E), or Non-essential (N).
• Vital drugs (V) are potentially life-saving and must be supplied regularly;
• Essential drugs (E) are effective for less severe diseases;
• Non-essential drugs (N) are used for minor or self-limiting conditions and may have questionable effectiveness (8).
However, it should be noted that ABC analysis is used to rank medicines based on expenditure levels, highlighting the drugs that consume the largest portion of a healthcare organization’s budget. This approach, however, does not reflect their medical importance. Conversely, VEN analysis focuses on determining the degree of medical necessity, classifying drugs as Vital (V), Essential (E), or Non-essential (N), but it does not consider the financial aspect. Using these methods separately limits the completeness of the assessment. Combining both methods in the ABC–VEN framework allows for simultaneous consideration of two key criteria: financial burden and clinical importance (9). This approach helps set priorities in procurement planning, especially under the limited resources of our republic’s healthcare system.
The advantages of this analysis lie in its comprehensive nature, as it considers both the economic component and the clinical significance of each drug. It identifies priority medicines that are both high-cost and highly important for patients, enabling targeted monitoring of these critical items (10).
The application of ABC–VEN analysis reduces the likelihood of shortages of vital and essential medicines and prevents excessive procurement of secondary items, thereby optimizing expenditures. The ABC–VEN matrix facilitates decision-making in budgeting and procurement policies, providing managerial support to healthcare administrators. Rational allocation of resources contributes to cost reduction and more transparent management of drug supplies, which enhances the efficiency of healthcare delivery (11).
We concluded that ABC–VEN analysis is a universal tool for evaluating the rationality and management of drug procurement. Its implementation allows for the combination of cost control with ensuring the availability of vital and essential medicines. This is particularly relevant for healthcare systems operating under limited funding and the need to improve the efficiency of resource allocation.
The aim of our study was to analyze the profile of drug utilization and the associated financial expenditures in a cardiology hospital using ABC–VEN analysis.
Methods
A retrospective observational study was conducted using annual turnover and balance statements of drug procurement from 2021 to 2024 in a cardiology healthcare organization in Bishkek.
A list of medicines and expenditure structure was compiled using Microsoft Excel. Data were entered into Excel columns to create a comprehensive drug list with the following parameters: International Nonproprietary Name (INN), Trade name, Dosage form, Unit of measurement (tablet, IU, ampoule, vial), Price per unit (in Kyrgyz soms, KGS), Number of units per package, Quantity of drugs used (in units), Total expenditure (in Kyrgyz soms, KGS) as presented in Table 1.
|
Table 1. Characteristics of prescribed drugs and their consumption, price and total expenditure |
||||||||
|
№ |
INN (International Nonproprietary Name) |
Trade name of the drug |
Dosage form |
Unit of measurement |
Price per unit (KGS) |
Number of units per package |
Consumption (absolute quantity) |
Total expenditure (KGS) |
|
1 |
|
|
|
|
|
|
|
|
|
2 |
|
|
|
|
|
|
|
|
|
.. |
|
|
|
|
|
|
|
|
The expenditure for each drug and the quantity of drugs consumed by each INN during the analyzed period (one year) were determined. The total expenditure for all drugs was considered as 100%, and the share of each drug in the total pharmaceutical expenditure was calculated.
The percentage of expenditure was calculated using the following formula:
Share of drug expenditure in total costs (%) = (Total cost of the drug (KGS) / Total expenditure on all drugs (KGS)) × 100%
Next, the cumulative percentage was calculated by sequentially summing the expenditure percentage of each drug and the percentages of all preceding drugs. Medicines were then classified into three ABC groups based on the cumulative percentage, and the number of drugs in each group was counted.
Subsequently, drugs were categorized according to V, E, N criteria as follows:
•V (Vital) – medicines included in the latest edition of the NLEM KR relevant to the healthcare organization’s profile;
•E (Essential) – medicines included in the NLEM KR but not directly related to the organization’s profile, as well as drugs listed in approved clinical guidelines or additional organizational lists based on departmental requests, validated by a protocol of the Quality Committee and approved by the deputy head for medical work;
•N (Non-essential) – medicines not included in the latest NLEM KR edition or lacking evidence of efficacy and safety.
An ABC–VEN matrix analysis was then performed, identifying all medicines with attributes V, E, and N (according to the VEN code) that fell into the A, B, or C groups based on expenditure. The absolute and relative costs for these medicines were calculated for each INN.
Based on this analysis, three expenditure categories were defined to indicate the rationality of drug procurement in the healthcare organization:
•Category I expenditures: AV + BV + CV + AE + AN
•Category II expenditures: BE + CE + BN
•Category III expenditures: CN
These categories help evaluate the rationality of drug procurement in the healthcare organization.
Statistical analysis
Statistical analyses were carried out using Microsoft Excel and IBM SPSS Statistics 26.0 (New York, USA).
Descriptive statistical methods were used to analyze the expenditure structure by categories. For each category, the arithmetic mean (M), standard deviation (SD), median (Me), and interquartile range (IQR) were calculated. These measures allow characterization of the central tendency and variability of the data, as well as detection of potential skewness in the distribution.
To assess differences in expenditures among the three independent groups (categories I, II, III), the nonparametric Kruskal–Wallis H-test was applied. This method is suitable when more than two groups are compared, the data do not follow a normal distribution, and the sample size is limited. The test evaluates the null hypothesis (H₀) that all groups have the same distribution. Differences between groups were considered statistically significant at p < 0.05, and a post-hoc analysis was conducted using pairwise Mann–Whitney U tests to compare categories I vs II, I vs III, and II vs III.
For visual representation, boxplots were used to show the median, interquartile range, and potential outliers, and barplots with mean (SD) were used to assess the average expenditure level and variability within each category. This combination of descriptive statistics and nonparametric analysis provided a robust assessment of differences in expenditure categories under limited sample size conditions.
Additionally, a scenario analysis was conducted to evaluate the impact on the budget if Category III expenditures were excluded for 2021–2024. Actual data were compared with three alternative scenarios in which Category III expenditures were redistributed to Categories I and II: all Category III expenditures to Category I, all Category III expenditures to Category II, or Category III expenditures evenly divided between Categories I and II. A Pearson correlation analysis was performed to assess the relationship between actual expenditures and the scenario where all Category III costs were redistributed between Categories I and II. The analysis included expenditures for Categories I, II, III, and total expenditure sums for 2021–2024.
Results
ABC analysis is used in healthcare organizations to rationalize procurement activities and prioritize the acquisition of vital and essential medicines according to the profile of medical care provided. Our analysis was conducted using turnover and balance statements of the organization for 2021–2024. In 2021, a total of 31,745,956.80 KGS was spent on all 149 medicines of the analyzed list.
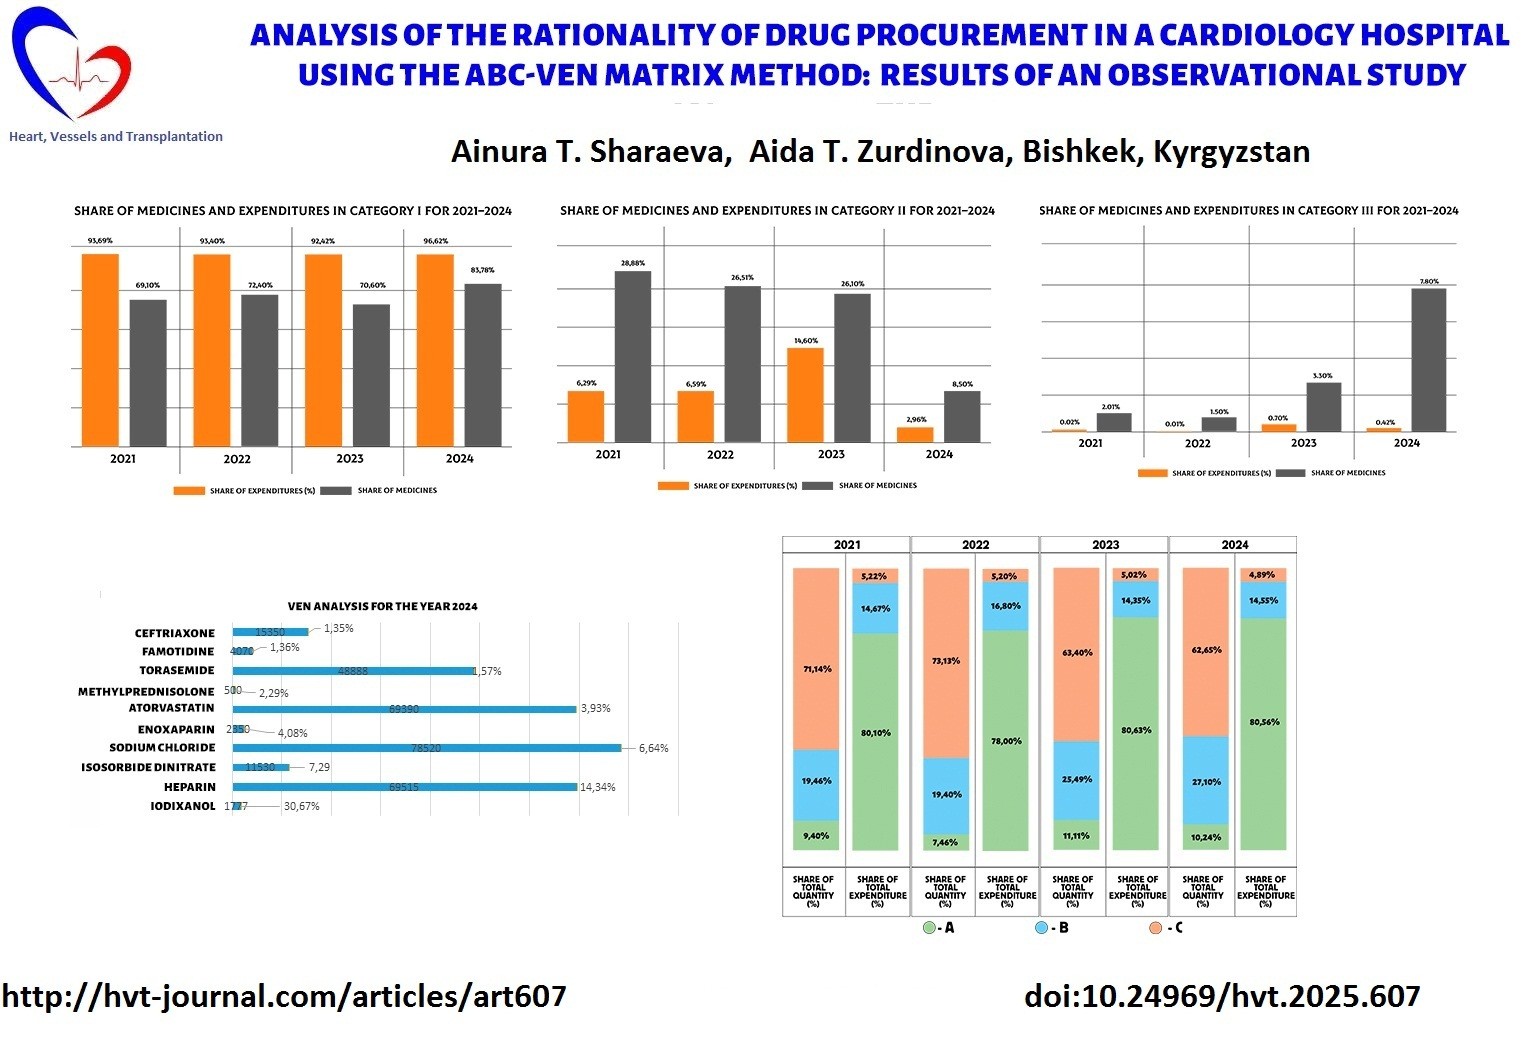
As shown in Figure 1, 14 medicines (9.40%) in Category A accounted for 80.10% of total expenditures, totaling 25,430,034.36 KGS; 29 medicines (19.40%) in Category B accounted for 19.46% of total expenditures, totaling 4,658,200.03 KGS; and 106 medicines (71.14%) in Category C accounted for 5.22% of total expenditures, totaling 1,657,722.41 KGS.
The distribution of funds across the three groups (classes) according to actual consumption in 2021 showed that 9.40% of medicines consumed 80.10% of the budget (Class A), 19.46% of medicines consumed 14.67% of the budget (Class B), and 71.14% of medicines consumed 5.22% of the budget (Class C), which overall corresponded to WHO criteria.
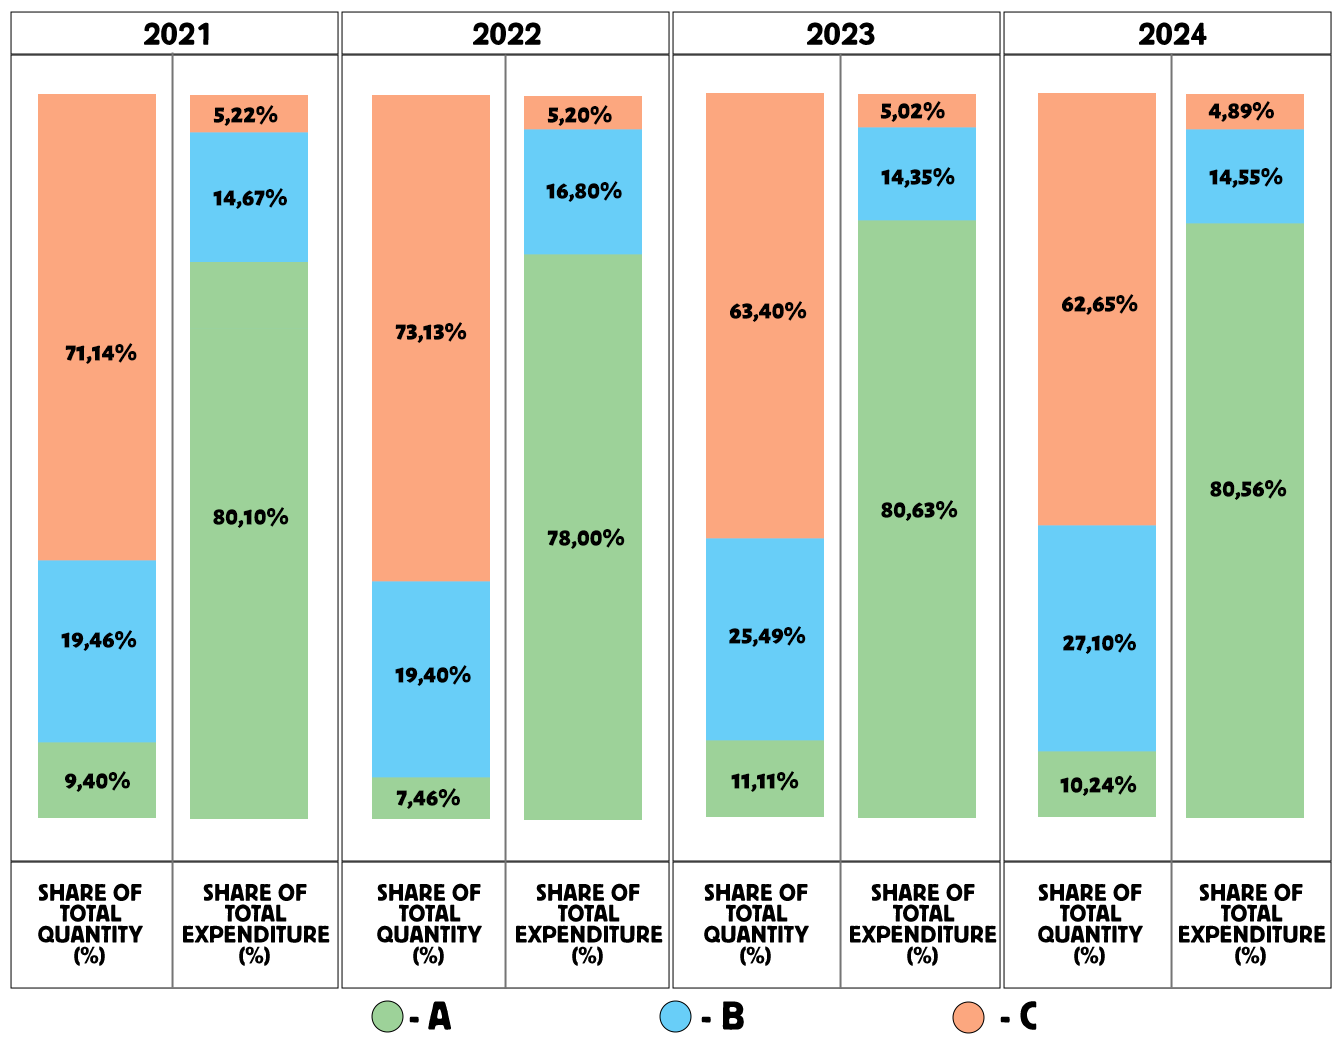
Figure 1. ABC Analysis of drug procurement from 2021 to 2024
The analysis of purchases for 2022 showed that a total of 32,862,919.34 KGS was spent on all 134 drugs included in the analyzed list. Of these, 10 drugs (7.46%) in group A accounted for 78% of total expenses — 25,632,465.02 KGS; 26 drugs (19.40%) in group B (16.80% of total expenses) accounted for 5,521,529.14 KGS;
and 98 drugs (73.13%) in group C (5.20% of total expenses) accounted for 1,708,925.18 KGS. The use of funds across the three groups (classes), based on actual consumption in 2022, showed that 7.46% of drugs consumed 78% of the budget (Class A), 19.40% of drugs consumed 16.80% (Class B), and 73.13% of drugs consumed 5.20% (Class C) — which is consistent with WHO criteria (1).
The results of the ABC analysis for 2023 revealed that a total of 24,533,887.54 KGS was spent on 153 drugs purchased by the organization during the reporting year. Of these, 17 drugs (11.11%) in group A accounted for 80.63% of total expenses — 19,781,510 KGS; 39 drugs (25.49%) in group B (14.35% of total expenses) accounted for 3,519,877.16 KGS; and 97 drugs (63.40%) in group C (5.02% of total expenses) accounted for 1,232,500.38 KGS. Thus, 11.11% of drugs consumed 80.63% of the budget (Class A), 25.49% consumed 14.35% (Class B), and 63.40% consumed 5.02% (Class C) — again consistent with WHO recommendations (1).
The ABC analysis for 2024 showed that a total of 27,409,180.52 KGS was spent on 166 drugs from the analyzed list. Of these, 17 drugs (10.24%) in group A accounted for 80.56% of total expenses — 22,079,700.83 KGS; 45 drugs (27.10%) in group B (15% of total expenses) accounted for 3,988,566.21 KGS;
and 104 drugs (62.65%) in group C (5% of total expenses) accounted for 1,340,913.48 KGS. The distribution of funds by actual consumption in 2024 showed that 10.24% of drugs consumed 80% of the budget (Class A), 27.10% consumed 15% (Class B), and 62.65% consumed 5% (Class C).
As part of our study, we also conducted a VEN analysis to determine the share of expenditures on vital, essential, and non-essential medicines.
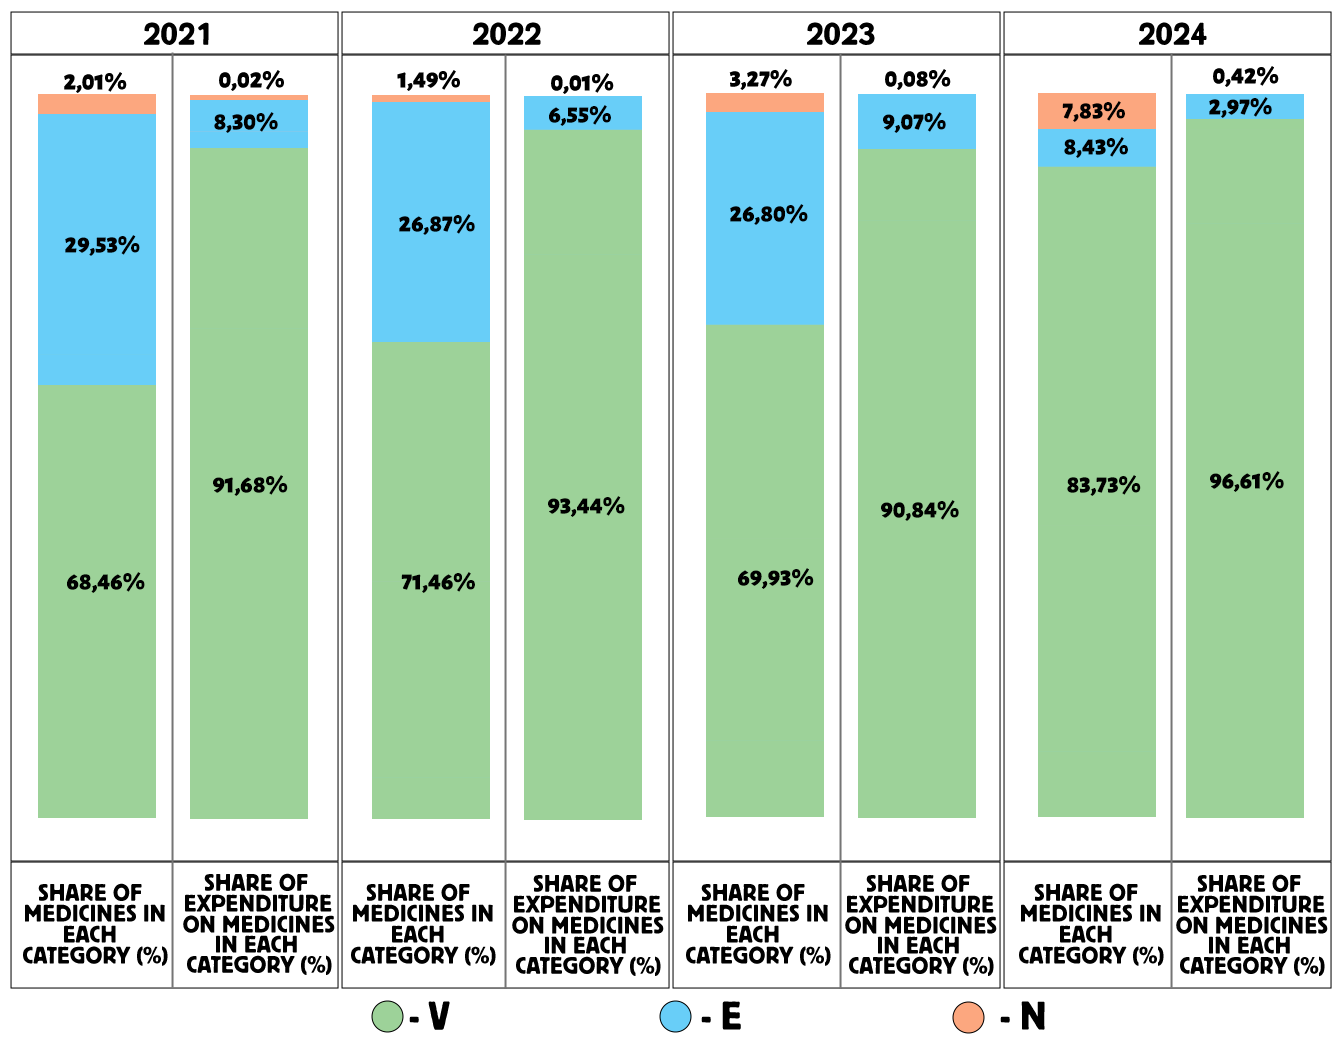
Figure 2. VEN analysis of cardiology drug procurement from 2021 to 2024
As shown in Figure 2, the VEN analysis for 2021 revealed that 68.46% of the medicines belonged to group V (vital medicines), accounting for 91.68% of total expenditures; 29.53% of medicines belonged to group E (essential medicines), accounting for 8.30% of expenditures; and 2.01% of medicines were in group N (non-essential medicines), accounting for 0.02% of expenditures.
Priority in drug selection was given to group V (68.46%) and group E (29.53%), while group N accounted for only 2.01%. It is recommended to reduce the number of drugs in group N and reallocate these funds to groups V and E.
The VEN analysis for 2022 showed that 71.64% of medicines were in group V, accounting for 93.44% of expenditures; 26.87% were in group E, accounting for 6.55%; and 1.49% were in group N, accounting for 0.01%.
Thus, priority in selection was given to group V (71.64%) and group E (26.87%), while group N represented only 1.49%.
The VEN analysis for 2023 indicated that 69.93% of medicines were in group V, accounting for 90.84% of expenditures; 26.80% were in group E, accounting for 9.07%; and 3.27% were in group N, accounting for 0.08% of total expenditures. Priority in medicine selection was again given to group V (69.93%) and group E (26.80%).
The VEN analysis for 2024 demonstrated that 83.73% of medicines were classified as vital (group V), accounting for 96.61% of total expenditures; 8.43% of medicines were in group E, accounting for 2.97%; and 7.83% of medicines belonged to group N, accounting for 0.42% of expenditures. The priority in medicine selection was given to group V (84%), followed by group E (8.43%) and group N (7.83%).
The largest share of total expenditures (96.61%) was directed toward vital medicines (V) compared to groups E and N.
The VEN analysis from 2021 to 2024 demonstrates a steady growth in the share of vital medicines (V): from 68.46% in 2021 to 83.73% in 2024, showing an increase of 15.27%. In 2022, the share was 71.64% (an increase of 3.18%), and in 2023 — 69.93% (an increase of 1.47%) compared with 2021. This growth trend is considered a positive indicator in the procurement of medicines.
The share and expenditures for group E also showed a positive dynamic, as the number of medicines and spending on this category decreased over time.
However, when analyzing group N (non-essential medicines) from 2021 to 2024, a negative trend is observed — both the share of medicines and expenditures in this group increased during the study period. This group included drugs such as Vaseline, Nitrofural, and Ammonia solution, which are absent from NLEM KR (latest edition) and lack evidence of efficacy and safety.
Further, an ABC/VEN matrix analysis was conducted for the years 2021 to 2024. Figure 3 presents the results of this analysis for 2021, where 68.46% of all medicines included in the list were classified as vital (V).
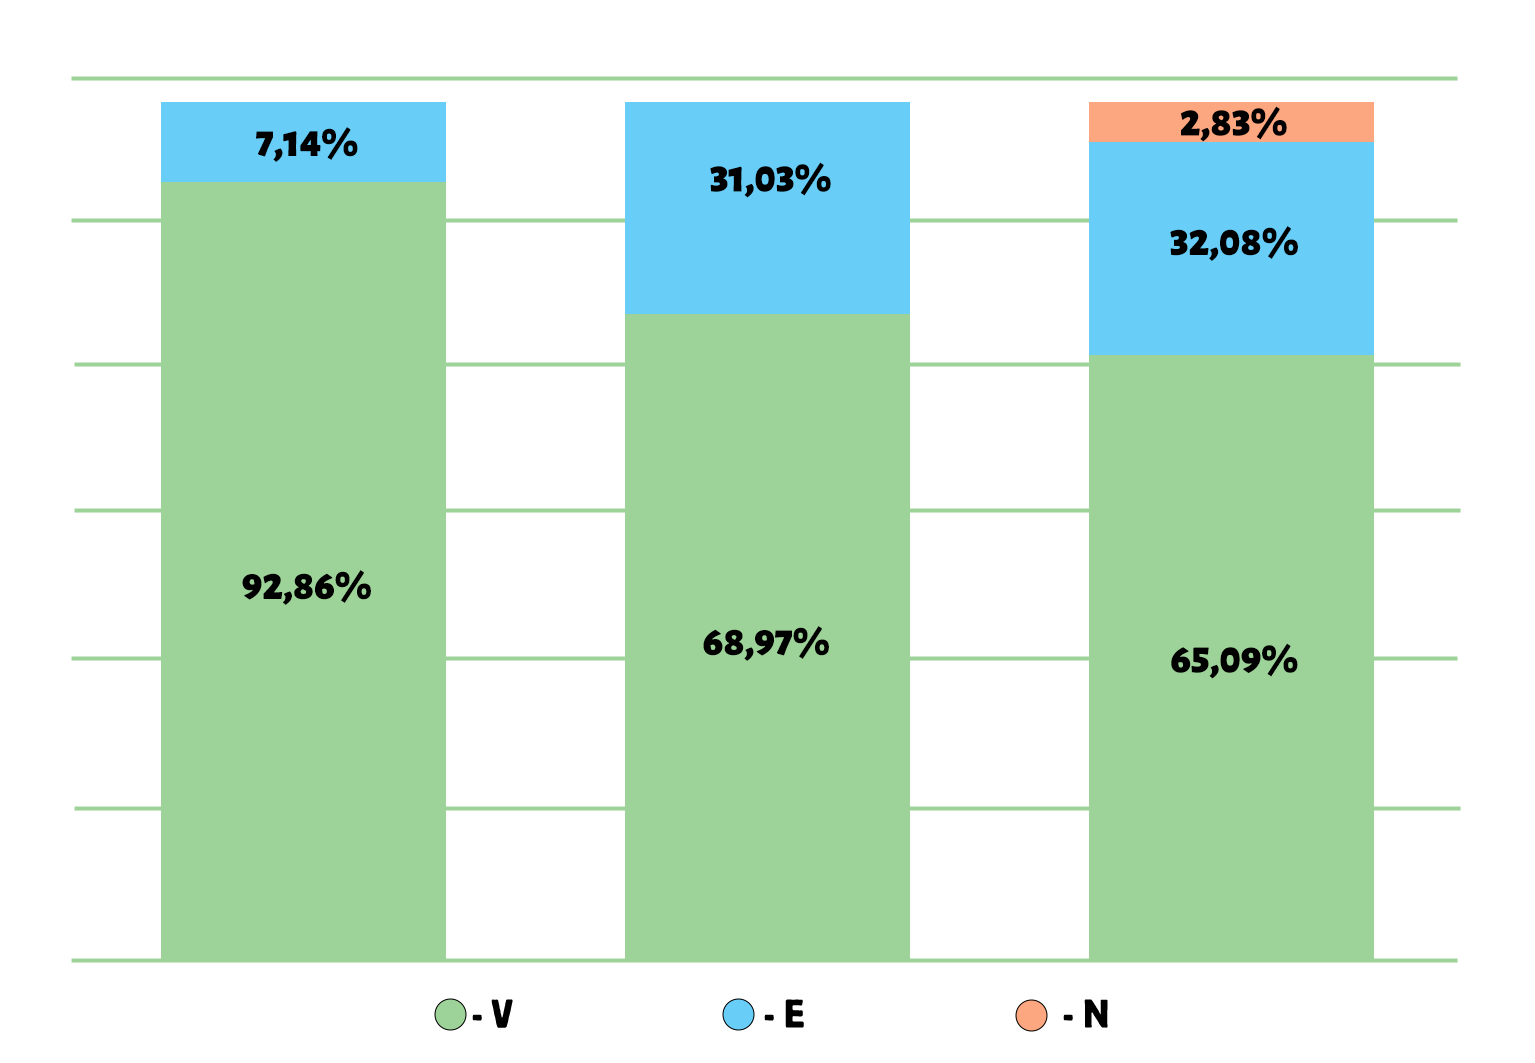
Figure 3. Results of the ABC/VEN matrix analysis for cardiology drugs in 2021
Of all the medicines analyzed, 29.53% were classified as essential (E) and 2.01% as non-essential (N). In group A, which accounted for 80.10% of total expenditures, there were 92.86% of medicines from group V, 7.14% from group E, and 0% from group N. In group B (representing 14.67% of total expenditures), there were 68.97% of medicines from group V, 31.03% from group E, and 0% from group N. In group C (representing 5.22% of total expenditures), there were 65.09% of medicines from group V, 32.08% from group E, and 2.83% from group N.
The distribution of expenditures across the ABC/VEN matrix showed that the first expenditure category included the most costly and vital medicines: Class A – Group V (92.86%), Group E (7.14%), and Group N (0%). The second expenditure category included less costly but important medicines: Class B – Group V (68.97%), Group E (31.03%), Group N (0%), and Class C – Group V (65.09%), Group E (32.08%). The third expenditure category, representing less important and least costly medicines, accounted for 2.83% of total expenditures (CN).
As shown in Figure 4, the ABC/VEN matrix analysis for 2022 demonstrated that 71.64% of all medicines included in the list were classified as vital (V), 26.87% as essential (E), and 1.49% as non-essential (N). In group A, which accounted for 78% of total expenditures, 100% of the medicines belonged to group V, while 0% belonged to groups E and N. In group B (representing 16.80% of total expenditures), 65.38% of medicines were from group V, 34.62% from group E, and 0% from group N. In group C (representing 5.14% of total expenditures), 70.41% of medicines belonged to group V, 27.55% to group E, and 2.04% to group N.
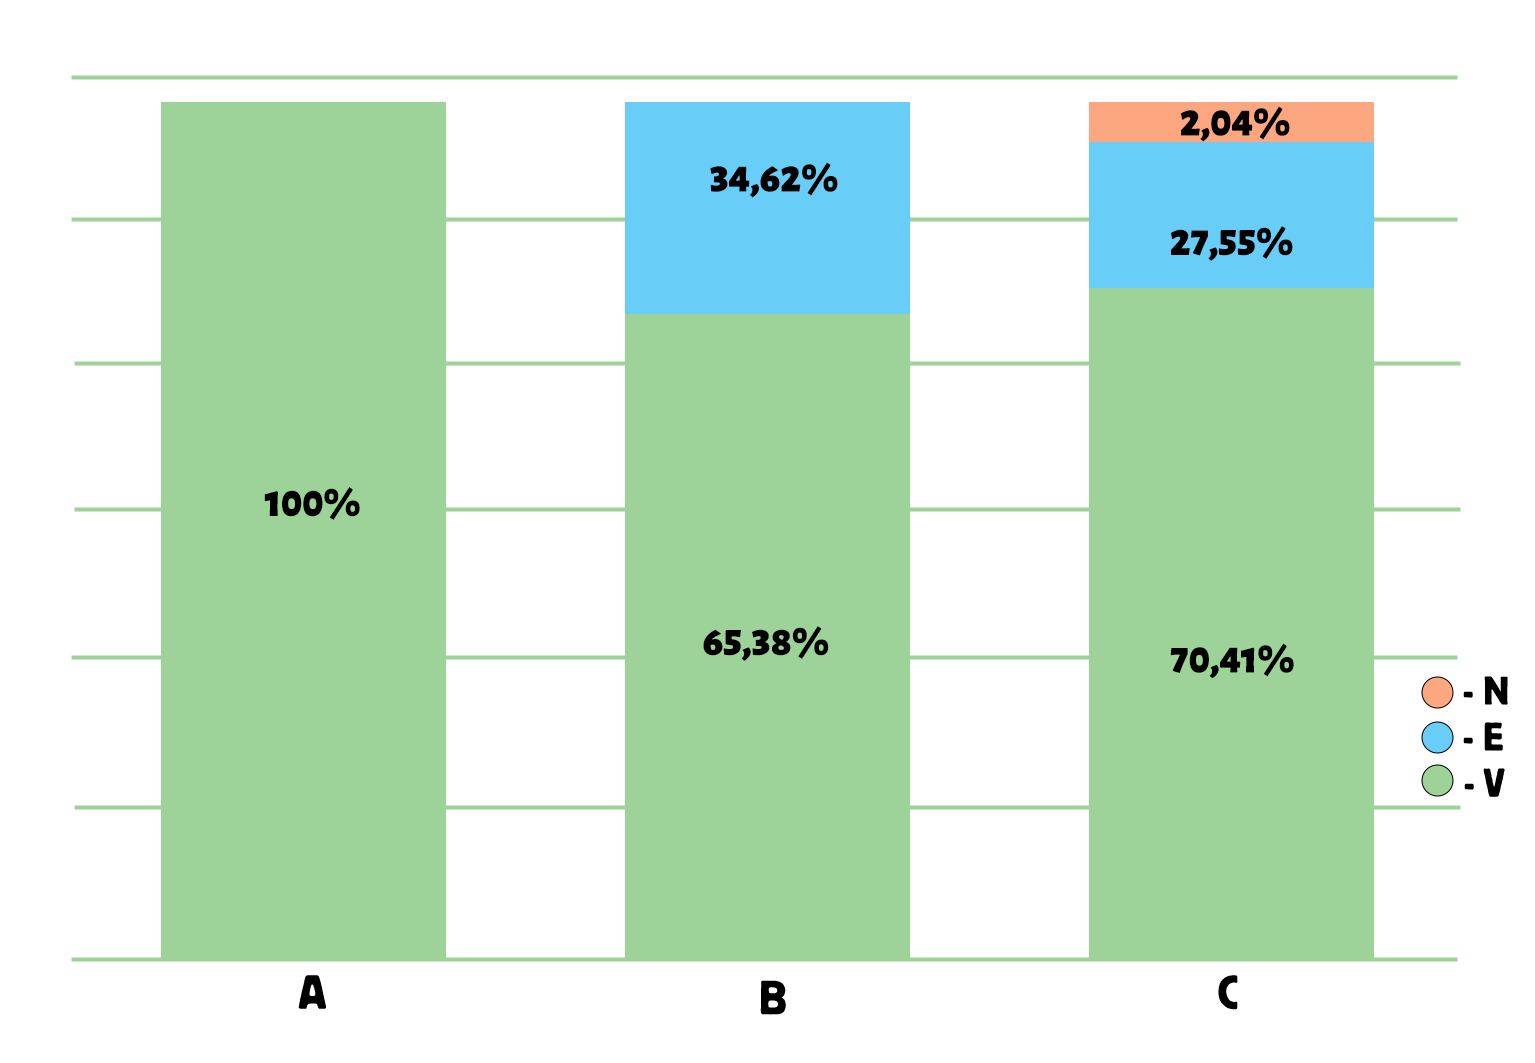
Figure 4. Results of the ABC/VEN matrix analysis for cardiology drugs in 2022
The distribution of expenditures across the ABC/VEN matrix showed that the first expenditure category included the most costly and vital medicines: Class A – Group V (100%), Group E (0%), and Group N (0%); as well as Class B – Group V (65.38%) and Class C – Group V (70.41%). The second expenditure category included less costly but important medicines: Class B – Group E (34.62%), Group N (0%), and Class C – Group E (27.55%). The third expenditure category, which comprised less important and least costly medicines, accounted for 2.04% of total expenditures (CN).
As shown in Figure 5, the ABC/VEN matrix analysis for 2023 revealed that 69.93% of all medicines included in the list were classified as vital (V), 26.80% as essential (E), and 3.27% as non-essential (N). In group A, which accounted for 80.63% of total expenditures, 94.12% of medicines belonged to group V, 5.88% to group E, and 0% to group N. In group B (representing 14.35% of total expenditures), 56.41% of medicines were from group V, 43.59% from group E, and 0% from group N. In group C, 71.13% of medicines were from group V, 23.71% from group E, and 5.15% from group N.
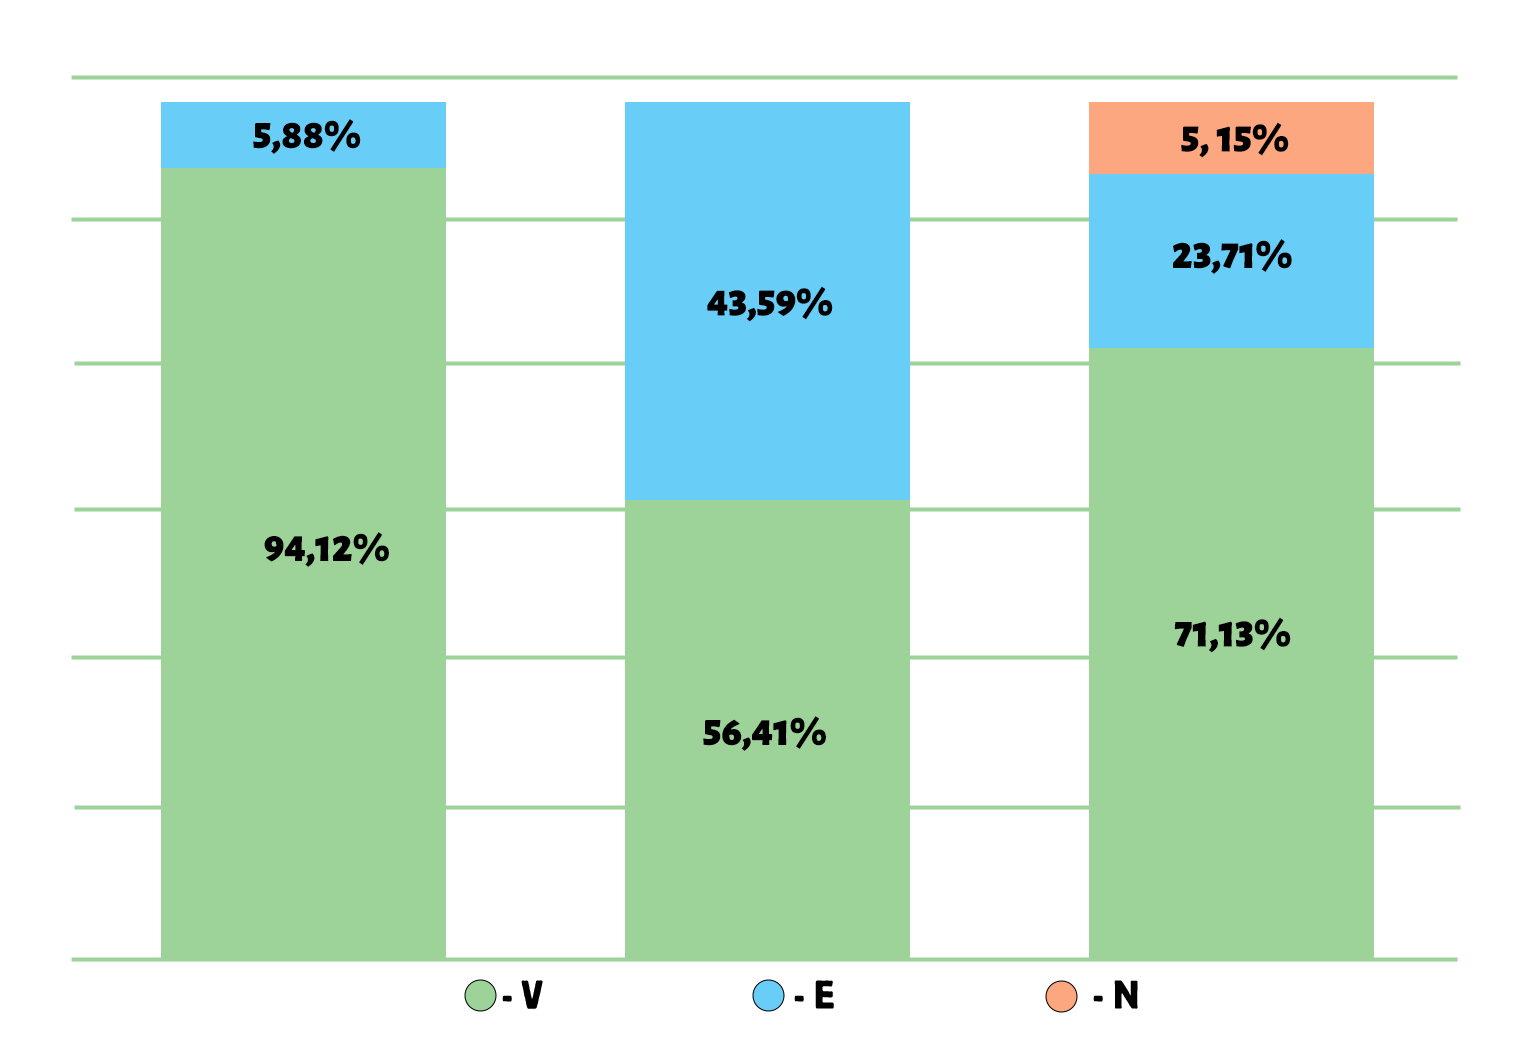
Figure 5. Results of the ABC/VEN matrix analysis for cardiology drugs in 2023
The distribution of expenditures across the ABC/VEN matrix showed that the first expenditure category included the most costly and vital medicines: Class A – Group V (94.12%), Group E (5.88%), and Group N (0%); as well as Class B – Group V (56.41%) and Class C – Group V (71.13%). The second expenditure category included less costly but important medicines: Class B – Group E (43.59%), Class C – Group E (23.71%), and Class B – Group N (0%). The third expenditure category, which included less important and least costly medicines, accounted for 5.15% of total expenditures (CN).
The obtained data indicate the need to revise procurement priorities — specifically, to increase the proportion of vital medicines in the second expenditure category and to reduce spending within the third category.
The results of the ABC/VEN matrix analysis for 2024, presented in Figure 6, show that among all medicines purchased in 2024, 83.73% were classified as vital (V), 8.43% as essential (E), and 7.83% as non-essential (N). In group A, which accounted for 80% of total expenditures, 100% of medicines belonged to group V. In group B (representing 15% of total expenditures), 82.22% of medicines were from group V, 17.78% from group E, and 0% from group N. In group C (representing 5% of total expenditures), 81.73% of medicines were from group V, 5.77% from group E, and 12.50% from group N.
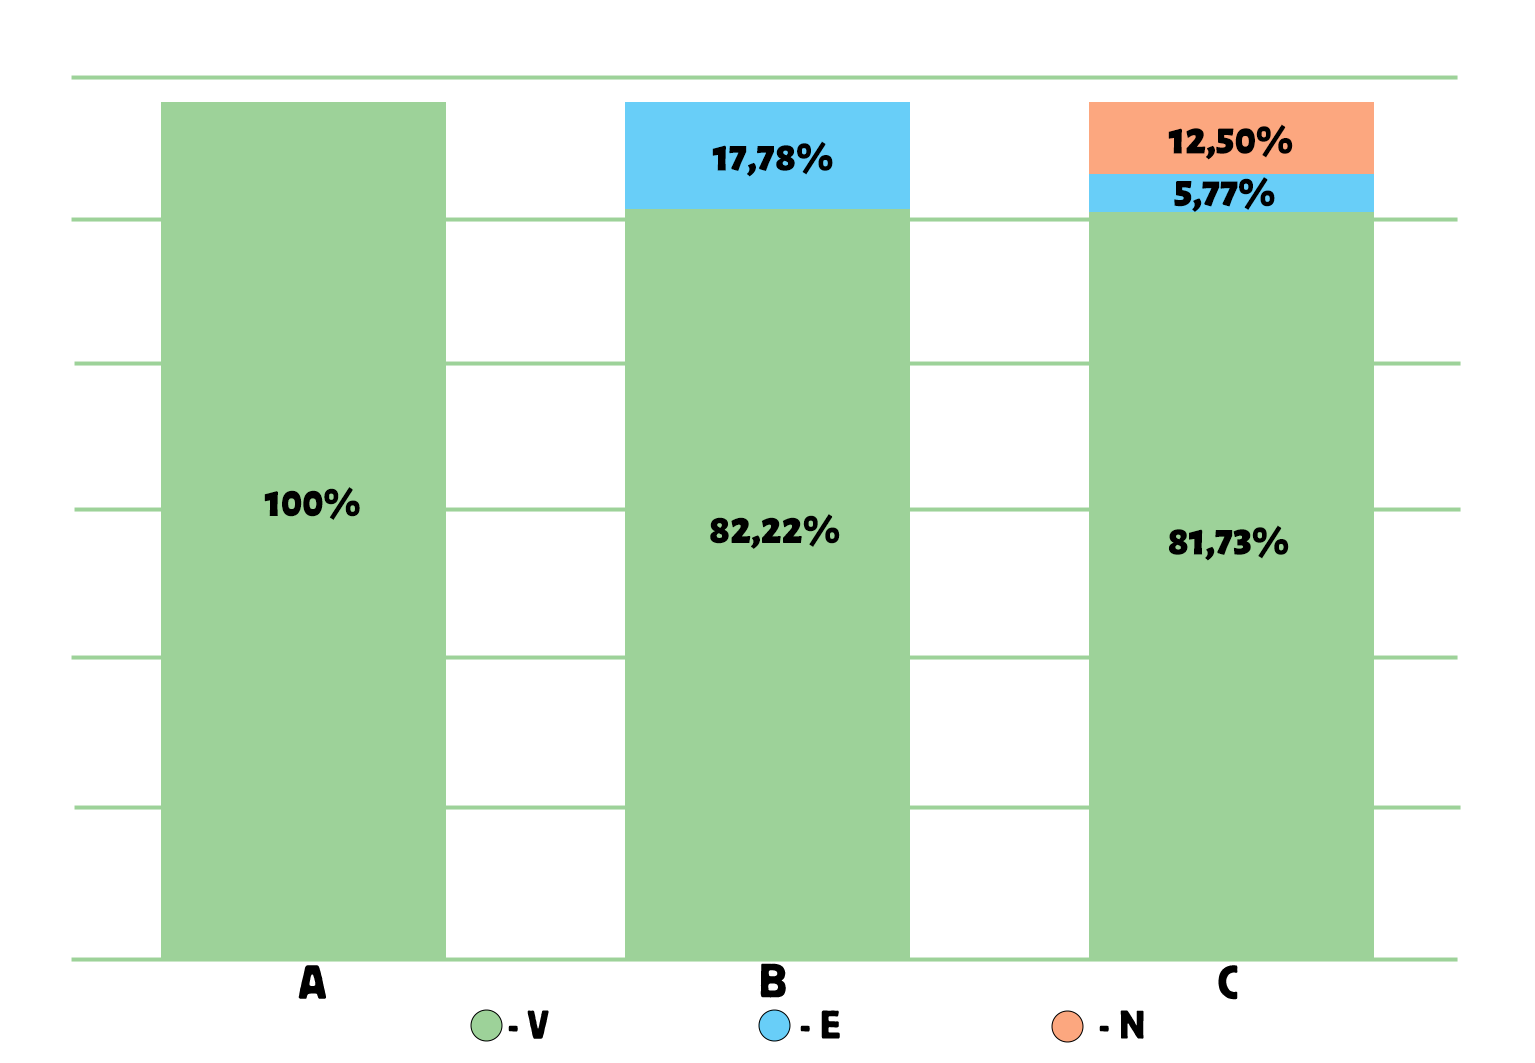
Figure 6. Results of the ABC/VEN matrix analysis for cardiology drugs in 2024
The distribution of expenditures across the ABC/VEN matrix showed that the first expenditure category included the most costly and vital medicines: Class A – Group V (100%), Group E (0%), and Group N (0%); as well as Class B – Group V (82.22%) and Class C – Group V (81.73%). The second expenditure category included less costly but important medicines: Class B – Group E (17.78%), Group N (0%), and Class C – Group E (5.77%). The third expenditure category, representing less important and least costly medicines, accounted for 12.50% of total expenditures (CN).
The obtained data suggest that procurements from the third expenditure category (CN) should be reviewed and optimized. It is recommended that future procurement decisions consider the main hospital and additional lists of essential medicines approved by the Ministry of Health of the Kyrgyz Republic.
Following the ABC/VEN matrix analyses for 2021–2024, a categorization of expenditures was conducted. For 2021, the first expenditure category (AV + BV + CV + AE + AN) included 103 medicines (69.1%); the second expenditure category (BE + CE + BN) included 43 medicines (28.89%); and the third expenditure category (CN) included 3 medicines (2.01%), as shown in Table 2 and Figure 7.
|
Table 2. Expenditure categories for 2021 |
||
|
Cost category |
Share of medicines, n (%) |
Expenditure in KGS, n (%) |
|
I category |
103 (69.1) |
29 746 853 (93.69) |
|
II category |
43 (28.89) |
1 992 957,59 (6.29) |
|
III category |
3 (2.01) |
5 612,23 (0.02) |
|
Total |
149 (100) |
31 745 956,80 (100) |
Table 3 shows the expenditure categories for 2022, where in Category I (AV+BV+CV+AE+AN) there were 97 medicines (72.4%), in Category II (BE+CE+BN) – 35 medicines (26.1%), and in Category III (CN) – 2 medicines (1.5%).
|
Table 3. Expenditure categories for 2022 |
||
|
Share of medicines,n (%) |
Expenditure in KGS, n(%) |
|
|
I category |
97 (72.4) |
30 706 097,1 (93.4) |
|
II category |
35 (26.1) |
2 152 972,24 (6.59) |
|
III category |
2 (1.5) |
3 850,0 (0.01) |
|
Total |
134 (100) |
32 862 919 б34 (100) |
For 2023, in Category I (AV+BV+CV+AE+AN) there were 153 medicines (70.6%), in Category II (BE+CE+BN) – 22 medicines (38.6%), and in Category III (CN) – 2 medicines (3.5%), as shown in Table 4.
|
Table 4. Expenditure categories for 2023 |
||
|
Cost category |
Share of medicines, n (%) |
Expenditure in KGS, n (%) |
|
I category |
108 (70.6 ) |
22 672 048,8 (92.42) |
|
II category |
40 (26.1) |
1 841 087,89 (14.6) |
|
III category |
5 (3.3) |
2 0750,92 (0.7) |
|
Total |
153 (100) |
24 533 888,00 (100) |
In 2024, Category I (AV+BV+CV+AE+AN) included 139 medicines (83.78%), Category II (BE+CE+BN) – 14 medicines (8.5%), and Category III (CN) – 13 medicines (7.8%), as presented in Table 5.
|
Table 5. Expenditure categories for 2024 |
||
|
Cost category |
Share of medicines, n (%) |
Expenditure in KGS, n (%) |
|
I category |
139 (83.78) |
26 480 174,5 (96.62) |
|
II category |
22 (8.5) |
813 851,49 (2.96) |
|
III category |
13 (7.8) |
115 154,54 (0.42) |
|
Total |
166 (100) |
27 409 180,52 (100) |
Next, an analysis of expenditures by categories from 2021 to 2024 was conducted. Figure 7 presents the shares of medicines and expenditures for Category I. This category is characterized by the highest share of expenditures and a significant proportion of medicines. In 2021–2023, expenditures remained consistently high (93.69–92.42%), while the share of medicines ranged from 69.10% to 72.40%. In 2024, a further increase was observed: expenditures rose to 96.62%, and the share of medicines reached 83.78%.
Data on expenditures for Category II from 2021 to 2024 are shown in Figure 8. It can be seen that Category II showed high expenditures in 2021–2022 (28.88% and 26.51%) with a relatively low share of medicines (6.29% and 6.59%). In 2023, expenditures remained high (26.10%), but the share of medicines increased sharply to 14.60%. However, in 2024 there was a significant decrease in both indicators: expenditures amounted to 8.50%, and the share of medicines dropped to only 2.96%.
. Data on Category III expenditures from 2021 to 2024 are presented in Figure 9, where it can be seen that Category III initially had low indicators: expenditures in 2021–2022 amounted to 2.01% and 1.50%, and the share of medicines — 0.02% and 0.01%. In 2023, an increase was observed: expenditures reached 3.30%, and the share of medicines — 0.70%. In 2024, another increase occurred: expenditures rose to 7.80%, while the share of medicines was 0.42%.

Figure 7. Shares of medicines and expenditures in Category I for 2021–2024
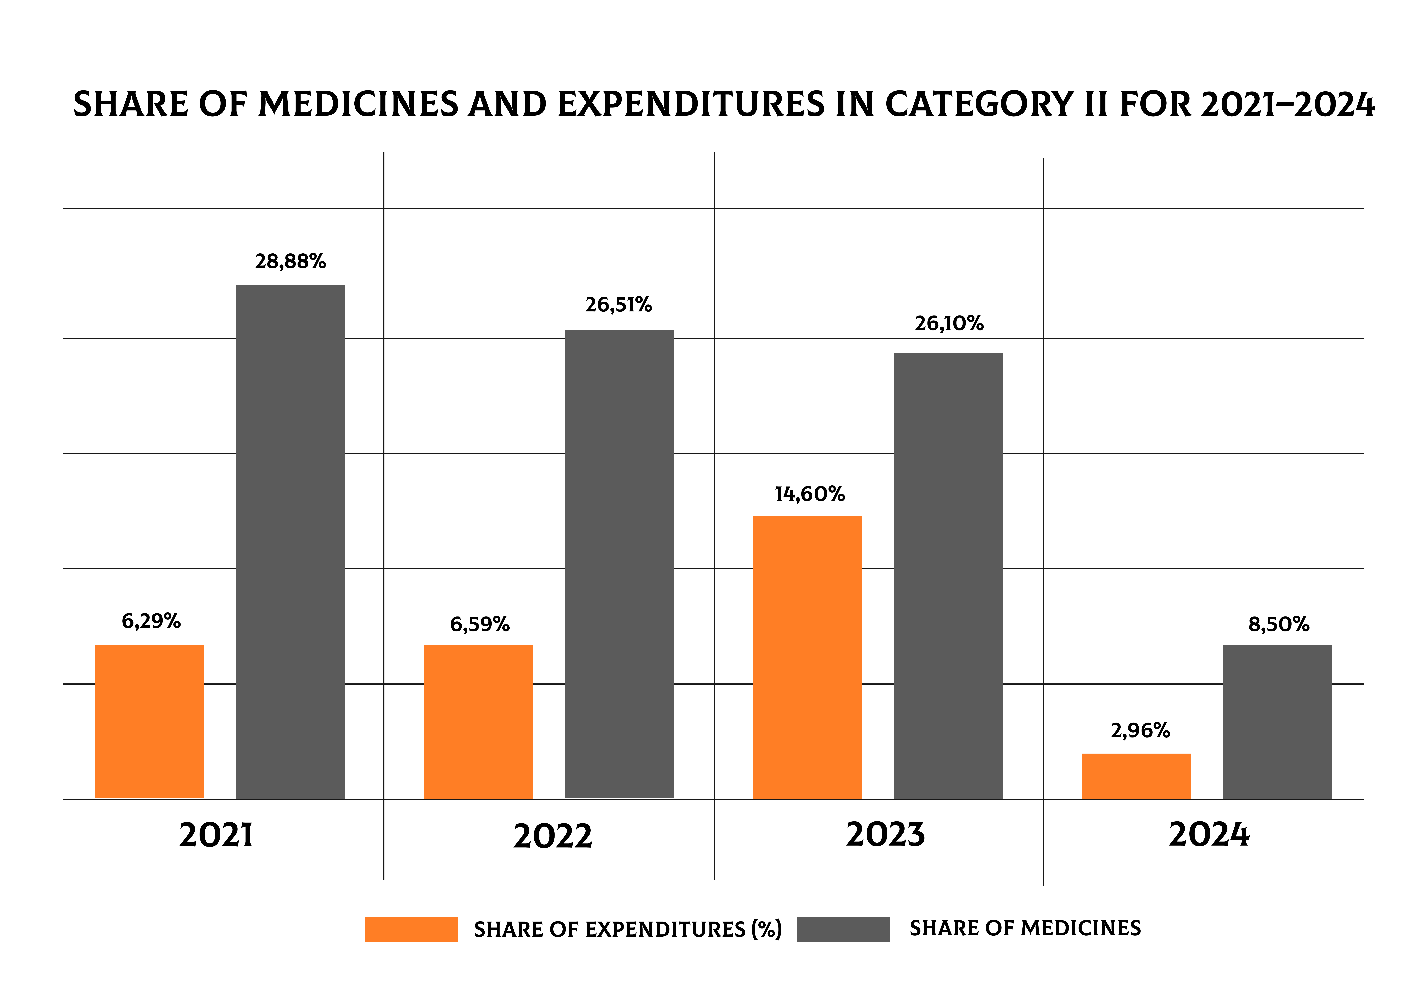
Figure 8. Shares of medicines and expenditures in Category II for 2021–2024

Figure 9. Shares of medicines and expenditures in Category III for 2021–2024
The analysis revealed significant differences in the distribution of expenditures among Categories I, II, and III. According to the data from 2021–2024, the average expenditures in Category I were substantially higher than those in Categories II and III. The average expenditure in Category I exceeded 26 million KGS, while in Category II it was around 0.8 million KGS, and in Category III less than 50 thousand KGS, as shown in Table 6.
|
Table 6. Descriptive statistical indicators of expenditures by categories (2021–2024) |
||||
|
Category |
Mean (M) |
Standard Deviation (SD) |
Median (Me) |
Interquartile Range (IQR) |
|
I |
27401293.35 |
3634904.49 |
28113513.75 |
4458520.95 |
|
II |
767542.30 |
770675.40 |
514911.86 |
858867.01 |
|
III |
36341.92 |
53086.56 |
13181.57 |
39180.15 |
|
Kruskal- Wallis test - H = 9.85, p = 0.0073 |
||||
To assess the differences in expenditures among the three independent groups (Categories I, II, and III), the nonparametric Kruskal–Wallis test (H-test) was applied. The result was H = 9.85, p = 0.0073, indicating that the differences in expenditures between the categories were statistically significant (p < 0.05).
The greatest burden on the budget was observed in Category I, with statistically significant differences between Categories I and II, as well as between Categories I and III (p<0.01). Significant differences were also noted between Categories II and III (p<0.05). These results confirm that the expenditure structure is primarily driven by the high-cost Category I, while Categories II and III play a relatively smaller role.
For data visualization of the median, interquartile range, and mean values, Boxplot and Barplot methods were used. The Boxplot revealed a pronounced skew of the distribution toward Category I, whereas Categories II and III showed considerably lower values with marked variability, as illustrated in Figure 10.
As shown in Figure 11 (Bar plot, mean (SD)), category I clearly dominates, highlighting its defining role in shaping the overall cost of pharmacotherapy.
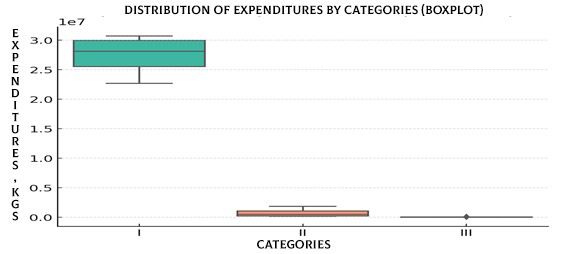
Figure 10. Distribution of expenditures by categories (Boxplot)
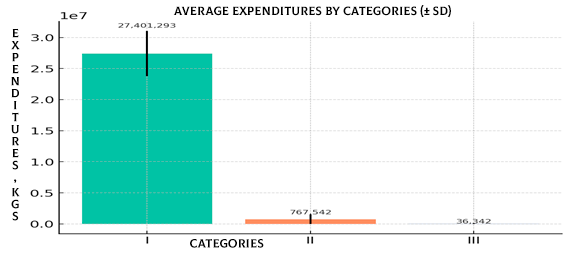
Figure 11. Mean expenditures by categories (SD) (Barplot)
Based on the obtained data, a budget impact analysis (BIA) was conducted to assess the effect of excluding Category III expenditures for the period 2021–2024. Actual data were compared with three alternative scenarios, in which the expenditures of Category III were redistributed between Categories I and II:
•Scenario A: All Category III expenditures are reallocated to Category I.
•Scenario B: All Category III expenditures are reallocated to Category II.
•Scenario C: Category III expenditures are evenly divided between Categories I and II, as shown in Table 7.
|
Table 7. Scenario analysis of budget impact (BIA) with exclusion of category III expenditures actual data |
||||
|
Year |
I cat. (KGS) |
II cat. (KGS) |
III cat. (KGS) |
Total (KGS) |
|
2021 |
29746853.00 |
199257.59 |
5612.23 |
31745956.80 |
|
2022 |
30706097.10 |
215972.24 |
3850.00 |
32862919.34 |
|
2023 |
22672048.80 |
1841087.89 |
20750.92 |
24533888.00 |
|
2024 |
26480174.50 |
813851.49 |
115154.54 |
27409180.52 |
|
Scenario A: All category iii expenditures reallocated to category i |
||||
|
2021 |
29752465.23 |
199257.59 |
0.00 |
31745956.80 |
|
2022 |
30709947.10 |
215972.24 |
0.00 |
32862919.34 |
|
2023 |
22692799.72 |
1841087.89 |
0.00 |
24533888.00 |
|
2024 |
26595329.04 |
813851.49 |
0.00 |
27409180.52 |
|
Scenario B: All category iii expenditures reallocated to category II |
||||
|
2021 |
29746853.00 |
204869.82 |
0.00 |
31745956.80 |
|
2022 |
30706097.10 |
219822.24 |
0.00 |
32862919.34 |
|
2023 |
22672048.80 |
1861838.81 |
0.00 |
24533888.00 |
|
2024 |
26480174.50 |
929006.03 |
0.00 |
27409180.52 |
|
Scenario C: Category III expenditures evenly divided between categories I and II |
||||
|
2021 |
29749659.11 |
202063.70 |
0.00 |
31745956.80 |
|
2022 |
30708022.10 |
217897.24 |
0.00 |
32862919.34 |
|
2023 |
22682424.26 |
1851463.35 |
0.00 |
24533888.00 |
|
2024 |
26537751.77 |
871428.76 |
0.00 |
27409180.52 |
The exclusion of Category III has virtually no impact on the overall budget, as its expenditures account for less than 1% of total costs. However, redistributing even these small amounts can strengthen the funding of Category I or II: Scenario A enhances the priority of Category I (essential, life-saving medicines), Scenario B reinforces Category II, improving balance and resource distribution, Scenario C achieves a compromise allocation, as visually illustrated in Figure 12.
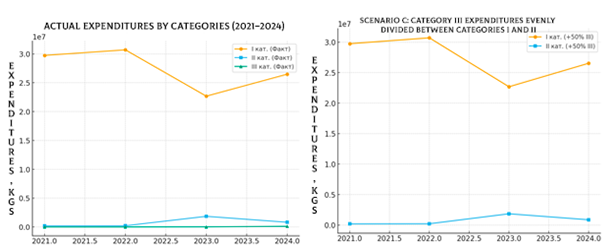
Figure 12. Comparison of actual expenditures by categories and budget impact under scenario C
The exclusion of Category III enables the redistribution of funds between Categories I and II without significantly affecting the overall budget, making the choice of scenario a matter of procurement policy priorities.
To assess the relationship between actual expenditures and Scenario C (redistribution of all Category III expenses to Category II), a Pearson correlation analysis was conducted. The analysis showed a perfect correlation for Category I and total expenditure between the actual data and Scenario C (correlation coefficient r = 1.0). For Category II, an almost perfect correlation was observed (r ≈ 0.9999), explained by the redistribution of Category III costs. In Scenario C, expenditures for Category III were absent (values equal to zero), so correlation coefficients were not calculated.
Thus, Scenario C maintains the overall structure and total budget, with differences limited to the redistribution between Categories II and III, which overall indicates rational procurement in this healthcare organization.
Discussion
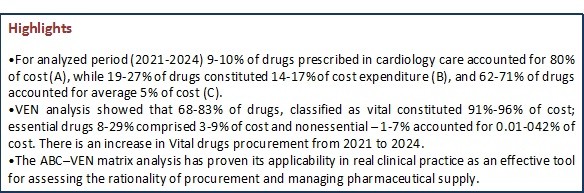
Our ABC-VEN analysis showed that (9.40% of medicines in Category A accounted for 80.10% of total expenditures, 19.40% in Category B accounted for 19.46% of total expenditures, and 71.14% in Category C accounted for 5.22% of total expenditures. We also demonstrated that Vital drugs, 68.46-83.73% of all medicines, constituted 91.68-96.61% of costs and Essential showed decreased trend from ¼ of all drugs to 8.4% with cost 8.43% to 2.46% of total from 2021 to 2024.
This corroborates with WHO recommendations (1), where 10–19% of drugs should account for about 80% of a healthcare organization’s budget. Based on our analysis, the expenditures on drugs in Group A from 2021–2024 generally complied with WHO recommendations. However, in 2022, both the share of drugs and expenditures were slightly lower compared to 2023, when they were somewhat higher. The analysis of expenditures for Group B drugs during the study period showed an upward trend in this category. A comparative analysis of the share of drugs and related expenditures in Group C for 2021–2024 revealed a decreasing trend, which we consider rational. According to WHO (1), approximately 20–30% of drugs should account for about one-quarter of total expenditures, which corresponds to our findings and can be considered a positive result.
Our analysis of expenditure and share of medicines by categories demonstrated that Category I (AV+BV+CV+AE+AN) consistently dominated through 2021-2023, with a notable increase in its significance in 2024 in terms of both expenditures 96.62% and the number of medicines (83.78%).However, Category II (BE+CE+BN) was characterized by pronounced fluctuations and a decrease in its significance in 2024 (expenditure 2.96% and medicines 8.5%) and Category III (CN) demonstrated a gradual increase in expenditures while maintaining a very low share of medicines. The expenditures on Category I were significantly higher than in Category II and III.
According to Mfizi E. et al. (9), their ABC-VEN analysis showed that Category I accounted for 55.80% of all medicines, representing 87.88% of total costs; Category II accounted for 40.70% and 11.82%, respectively, and Category III for 3.50% and 0.3%. Compared with our 2024 data and the Nyamagabe District data, the share of medicines and expenditures in Category I was lower, while those in Category II were significantly higher; the proportions for Category III were similar. Expenditures were distributed more evenly between Categories I and II, which is considered a positive outcome.
According to Migbaru S. et al. (6), their findings allowed to conclude that “according to the ABC-VEN matrix, most of the drugs belonged to Category I. Most Category I drugs, in turn, fell under classes A and V...” — which fully coincides with our results.
We demonstrated that budget analysis and scenarios of reallocation of funds from Category III to Categories I and II, significantly strengthen Categories I and II.
In summary, a significant portion of financial resources in Category I is directed toward medicines essential for high-tech medical care, underscoring the need for regular review of the formulary and procurement priorities considering both clinical and economic significance. Despite smaller expenditure volumes in Categories II and III, their optimization remains necessary. The budget impact scenario analysis confirms the priority of Category I procurement, which is essential for forecasting and planning the next fiscal year’s budget.
Study limitations
This study has several limitations that should be considered when interpreting the results:
Retrospective design. The analysis was conducted using existing medical documentation, which limits the ability to account for all clinical factors and specific features of therapy.
Focus on economic and classification parameters. The ABC–VEN analysis allows for assessment of expenditure structure and identification of priority drug groups; however, it does not consider clinical outcomes, such as treatment effectiveness or patient quality of life.
Price variability. Cost calculations were based on procurement prices during the study period, which may not reflect subsequent fluctuations in prices and currency exchange rates.
Conclusions
The ABC–VEN matrix analysis has proven its applicability in real clinical practice as an effective tool for assessing the rationality of procurement and managing pharmaceutical supply. It can be recommended as a means to enhance the justification of purchases, optimize the structure of the drug assortment, and serve as an efficient instrument for managing pharmaceutical resources under conditions of a limited budget.
Ethics: As neither patients nor participants were involved in study, the informed consent was not required. The Ethics Committee approval is also not required for retrospective study.
Peer-review: External and internal
Conflict of interest: None to declare
Authorship: A.T.S. and A.T.Z. equally contributed to the study and preparation of manuscript, thus fulfilled all authorship criteria.
Acknowledgement and funding: None to declare
Statement on A.I.-assisted technologies use: The authors did not use AI-assisted technologies in preparation of this manuscript
Data and material availability: Contact authors. Any sharing should be in form of collaboration and fair use with acknowledgement of source.
References
- 1.Xu K, Soucat, A, Kutzin J. Government health expenditure: A closer look at global trends. World Health Organization. 2018.
- 2.World Health Organization. World health statistics 2011.
- 3.Wulandari S, Sugiarto, S. Drug prescribing model using the ABC VEN method in RS X Semarang. Indon Health Manag J 2019; 7: 186–90.
- 4.Antonoglou D, Kastanioti C, Niakas D. ABC and VED analysis of medical materials in a military general hospital in Greece. J Health Manag 2017; 19: 170–9. Doi: 10.1177/09720634166826435
- 5.Sharma S. Tools for assessing and monitoring drug use. Pharm Med Transla Clini Res 2018; 445–63.
- 6.Migbaru S, Yigeremu M, Woldegerima B, Shibeshi W. ABC-VEN matrix analysis of pharmaceutical inventory management in Tikur Anbessa Specialized Hospital from 2009 to 2013, Addis Ababa, Ethiopia. Indian J Basic Appl Med Res 2016; 5: 734–43.
- 7.Pandya B, Thakkar H. Inventory management methods review: ABC–XYZ analysis. REST J Emerg Trends Model Manufact 2016; 2: 82–6.
- 8.Management Sciences for Health. MDS-3: Managing access to medicines and health technologies. Arlington: Lynne Rienner Publishers. 2012.
- 9.Mfizi E, Niragire F, Bizimana T, Mukanyangezi MF. . Analysis of pharmaceutical inventory management based on ABC-VEN analysis in Rwanda: A case study of Nyamagabe district. J Pharm Pol Pract 2023; 16: 30. doi: 10.1186/s40545-023-00540-5
- 10.Nguyen PH, Dang TVK, Nguyen PT, Vo TMH, Nguyen TTM. 5-year inventory management of drug products using ABC-VEN analysis in the pharmacy store of a specialized public hospital in Vietnam. Pharmacia 2022; 69: 517-25.
- 11.Mohammed S.A, Workneh BD. Critical analysis of pharmaceuticals inventory management using the ABC-VEN matrix in Dessie Referral Hospital, Ethiopia. Integr Pharm Res Pract 2020; 9: 113–25.
- Doi: 10.2147/IPRP.S265438
Copyright

This work is licensed under a Creative Commons Attribution-NonCommercial 4.0 International License.
AUTHOR'S CORNER
