Relation between obesity and diabetic nephropathy among patients with type 2 diabetes
ORIGINAL RESEARCH ARTICLE
Relation between obesity and diabetic nephropathy among patients with type 2 diabetes
Article Summary
- DOI: 10.24969/hvt.2026.623
- CARDIOVASCULAR DISEASES
- Published: 22/01/2026
- Received: 19/11/2025
- Revised: 07/01/2026
- Accepted: 07/01/2026
- Views: 1500
- Downloads: 1172
- Keywords: Obesity, type 2 diabetes mellitus, diabetic nephropathy, microalbuminuria
Address for Correspondence: Muhmmad Uzair, International Higher School of Medicine (IHSM), Intergelpo 1f, Bishkek, 720011, Kyrgyz Republic
Email: chuzairsarwar284@gmail.com Mobile: +996990014575
ORCID: Muhmmad Uzair - 0009-0009-6945-9104, Asylkan Z. Moldobaeva - 0009-0009-8283-5303
Muhammad Uzair1*, Asylkan Z. Moldobaeva1a
1International Higher School of Medicine (IHSM), Bishkek,720011, Kyrgyz Republic
1aPropedtherapy and Family Medicine Department, International Higher School of Medicine (IHSM), Bishkek,720011, Kyrgyz Republic
Abstract
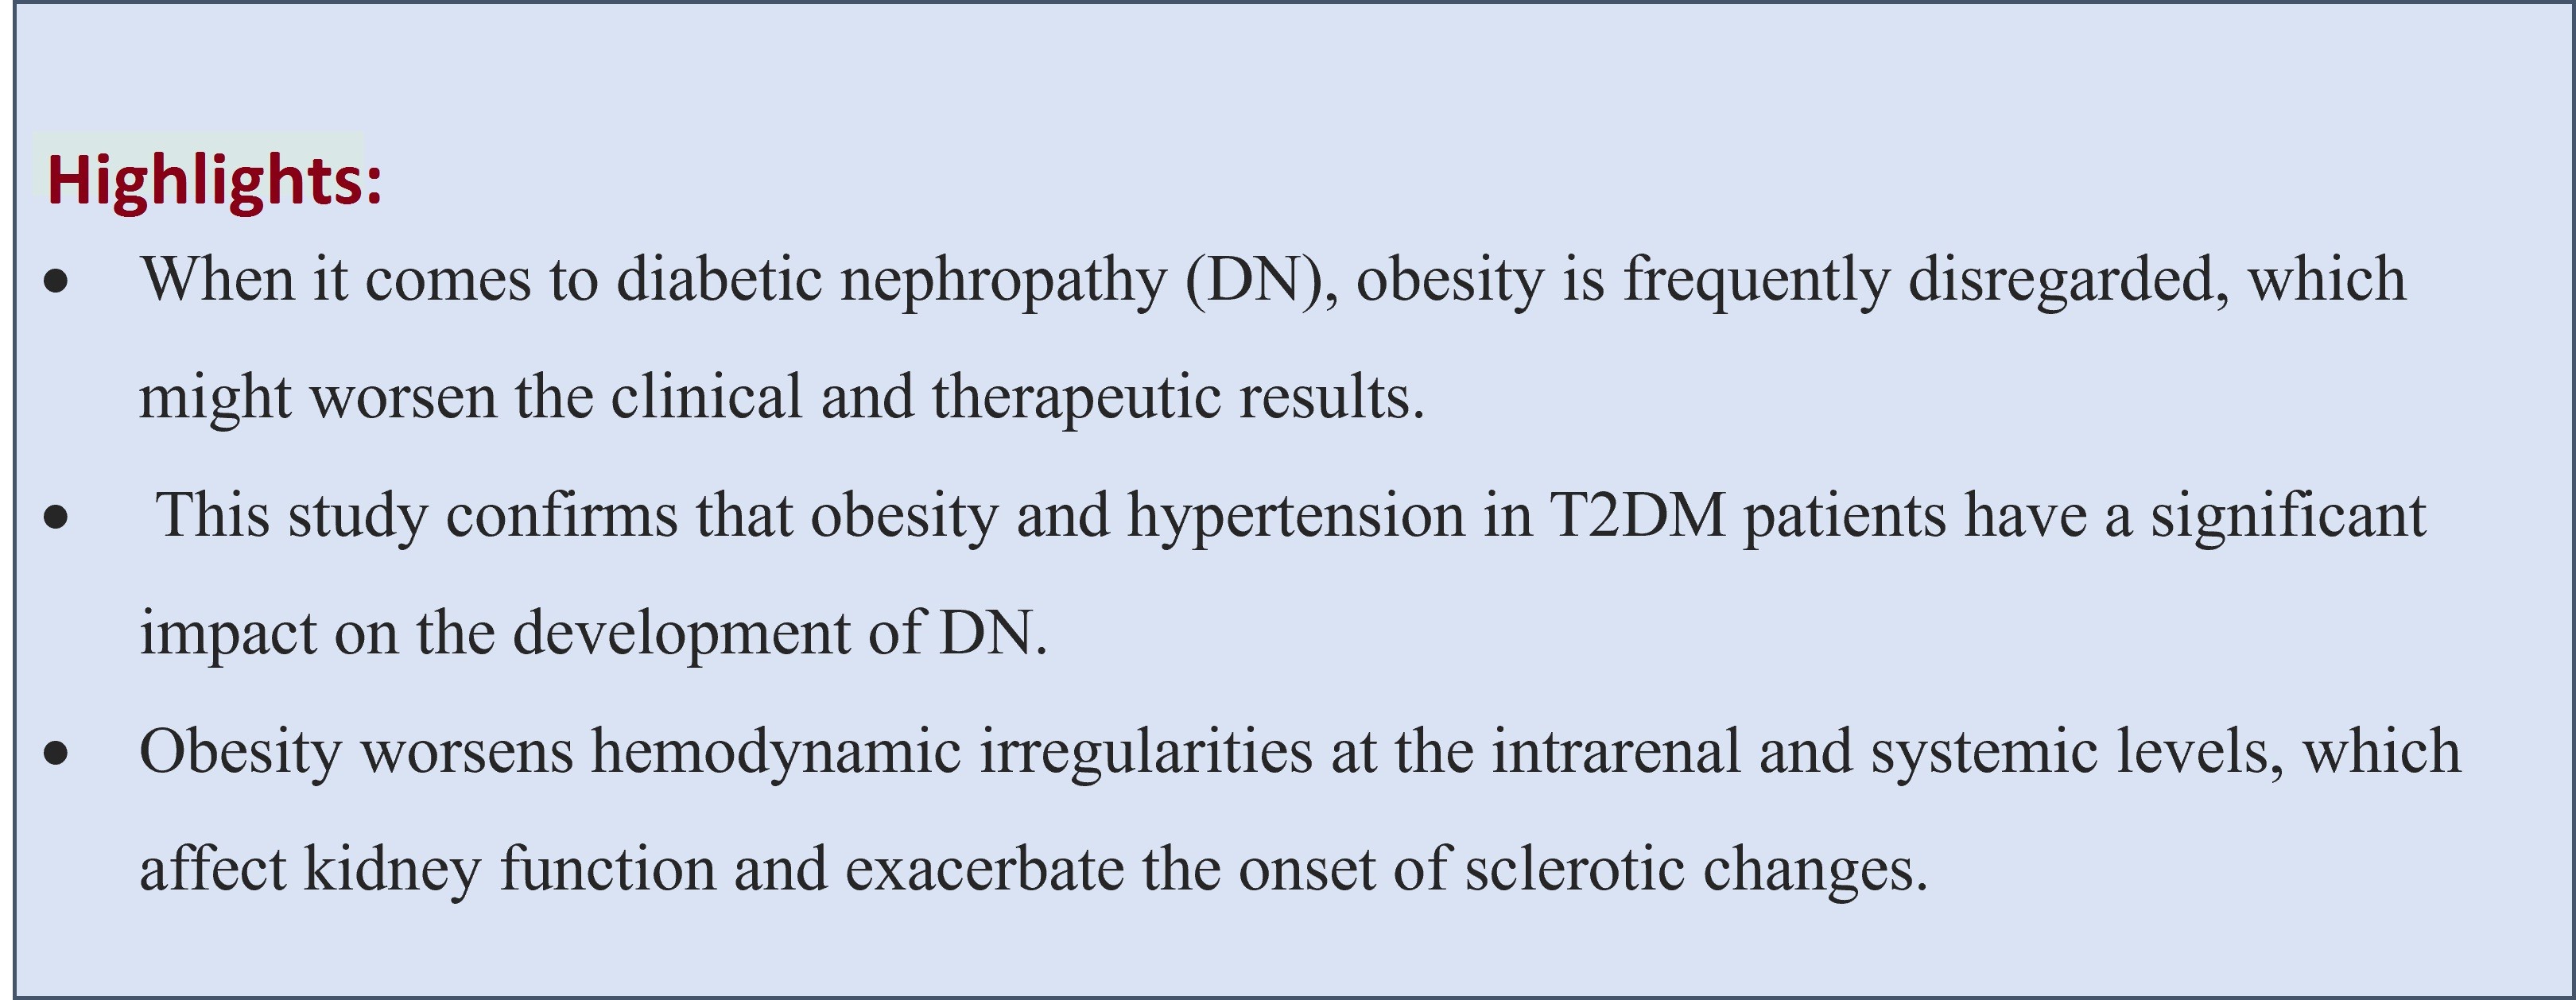
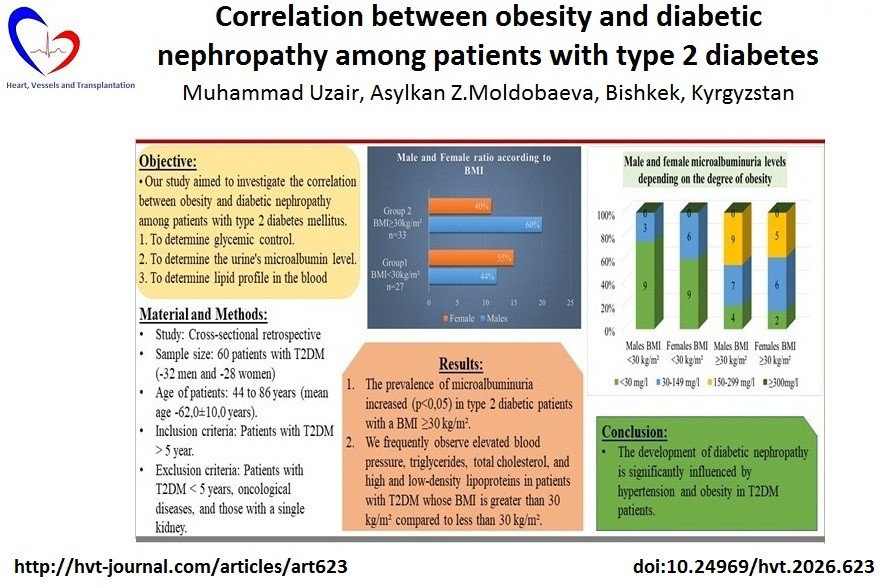
Objective: The most frequent consequence of diabetes mellitus (DM) is diabetic nephropathy (DN), and obesity is a prominent risk factor for DM. This cross-sectional study aimed to investigate the relationship between obesity and diabetic nephropathy in patients with type 2 diabetes mellitus (T2DM).
Methods: This cross-sectional retrospective study included 60 patients with T2DM (32 men and 28 women) aged 44 to 86 years (mean age 62.0 (10.0) years). Those patients included who have had T2DM for more than five years. Anthropometric parameters measured included body mass index (BMI), blood pressure (BP), and blood tests for glucose, glycosylated hemoglobin (HbA1C), total cholesterol, triglycerides, high-density lipoprotein (HDL), and low-density lipoprotein (LDL). The severity of diabetic nephropathy was assessed by the level of microalbuminuria in urine excretion. The patients were categorized into two groups: those with obesity (BMI ≥ 30 kg/m2) and those without (BMI < 30 kg/m2).
Results: The prevalence of microalbuminuria increased (p<0.05) in type 2 diabetic patients with a BMI ≥30 kg/m². We frequently observe elevated BP, triglycerides, total cholesterol, low HDL- and high LDL in patients with T2DM who have a BMI greater than 30 kg/m² compared with those who have a BMI less than 30 kg/m².
Conclusion: The development of diabetic nephropathy is significantly influenced by obesity in T2DM. However, in our investigation, no meaningful relation was found between HbA1c, lipid profile, and DN.
Key words: Obesity, type 2 diabetes mellitus, diabetic nephropathy, microalbuminuria
![]()
Graphical abstract
Introduction
Type 2 diabetes mellitus (T2DM) is a group of heterogeneous disorders with persistent hyperglycemia (1). According to the International Diabetes Federation (IDF), it is estimated that 589 million people aged 20 to 79 have diabetes. More than 4 out of 5 diabetic adults (81%) reside in low- and middle-income nations (2). Approximately 1.6 million deaths are directly caused by this illness each year (3). The World Health Organization (who) has labeled the recent surge in diabetes and obesity epidemics a "21st Century epidemic" (4).
Diabetic nephropathy (DN) is a common microvascular complication of T2DM and the leading global cause of end-stage renal disease, contributing significantly to morbidity and mortality. It affects nearly 40% of patients after approximately ten years of diabetes duration (5). The most prevalent cause of end-stage kidney disease in developed nations is DN, which affects 20–40% of patients in need of dialysis and/or transplantation (6).
Globally, obesity and chronic kidney disease (CKD) are significant public health issues. The WHO uses the body mass index (BMI) to categorize obesity, which it describes as "an excessive or abnormal accumulation of fat that poses a health risk." Adipocytes, however, also have strong endocrine roles. They secrete a variety of cytokines and adipokines that cause insulin resistance and a persistent low-grade inflammatory state, which harms the kidneys. The onset of CKD is linked to several metabolic changes that worsen insulin resistance and adipose tissue dysfunction (7, 8). Obesity is a risk factor for CKD-related disability and mortality after adjusting for diabetes and hypertension (9, 10). An estimated 74,801 people in the Kyrgyz Republic have diabetes mellitus as of 2021, making up 12% of the country's total population (11). The onset of albuminuria without renal failure (CKD stages 1-2) and CKD stages 3 and higher is predicted by a high BMI; the effect is significant only in obese persons (12). The progressive loss of kidney function brought on by a reduction in the number of functional nephrons is the hallmark of CKD.
Regardless of the cause, CKD is defined by KDIGO (Kidney Disease: Improving Global Outcomes) as a glomerular filtration rate (GFR) of less than 60 mL/min/per 1.73 m² or the presence of kidney damage indicators, or both, for a minimum of three months (13).
Obesity is a recognized contributor to T2DM and has been increasingly implicated in DN; however, the extent to which obesity independently influences the onset and progression of diabetic nephropathy remains to be fully elucidated. Some studies indicate that metabolic syndrome, including obesity, may be associated with the development of DN.
The aim of study was to investigate the relationship between obesity and diabetic nephropathy among patients with T2DM.
Methods
Study design and population
The study design is retrospective observational study. The data were gathered retrospectively from medical records for the period January 2024 - October 2024 at the Vedanta University Clinic in Bishkek, Kyrgyz Republic.
A total of 60 T2DM patients were included in the study; 32 were men, and 28 were women, with ages ranging from 44 to 86 (mean age 65 (10) years). The WHO's (1998) recommendations were followed in establishing the diagnosis of T2DM.
Patient Selection:
Two patient groups were identified based on BMI:
• Group 1 was considered to be non-obese (BMI < 30 kg/m²).
• Group 2 was considered to be obese (BMI ≥ 30 kg/m²).
Inclusion criteria: patients with T2DM and age >40 years. Exclusion criteria: patients with a single kidney, primary hypertension > 2nd stage, hemodynamically significant stenosis of the renal arteries, primary kidney damage within the context of systemic connective tissue illnesses, chronic glomerulonephritis, oncological diseases, and those with diabetes for less than five years.
Informed consent was obtained from patients for all procedures. The study was retrospective and used anonymized data; therefore, the Institutional Ethics Committee of (IHSM) waived the requirement for ethics approval. The study complies with the principles of the Declaration of Helsinki 2024.
Baseline variables
All patients demographic, disease duration, blood pressure levels, total cholesterol (TCH), triglycerides (TG), high-density lipoprotein (HDL), and low-density lipoprotein (LDL) cholesterol, blood sugar, and creatinine levels were analyzed in the blood serum collected after an overnight fast of 14 hours. Blood pressure (BP) was measured in each patient to check the hypertension stages.
Obesity and body mass index
The formula for calculating BMI is weight in kilograms divided by height in meters squared. Adults with a BMI of 25–29.9 kg/m²were considered overweight or pre-obese, and those with a BMI of ≥ 30 kg/m² were considered obese (14).
Outcome variables
High-performance liquid chromatography was used to determine glycated hemoglobin (HbA1c) levels. The recommended cut point for the diagnosis of diabetes is a HbA1c of 6.5%. A glucose test result of less than 6.5% does not rule out diabetes(15).
Glomerular Filtration Rate (GFR) and albuminuria levels were used to assess kidney damage. CKD was diagnosed according to KDIGO. Hyperfiltration was indicated by a GFR exceeding 130 ml/min/1.73 m², as determined by urine albumin excretion levels.
DN was diagnosed on the basis that urine albumin levels: below 30 mg/L were considered normal, levels between 30-299 mg/L indicated microalbuminuria, and levels exceeding 300 mg/dL that were confirmed on at least 2 occasions, 3-6 months apart, were classified as macroalbuminuria (16).
Statistical analysis
To perform statistical analysis, the 2010 Excel was used for data entrance. SPSS for Windows, version 16 was used for statistical analysis. Mann-Whitney method was used to assess the significance of the differences between the two groups (n) in study variables and microalbuminuria. A p-value of <0.05 was considered reliable.
Results
Baseline characteristics of participants
The baseline characteristics of both groups are summarized in Table 1. Baseline demographics show both groups, which were further divided into male and female, were comparable, with a p-value>0.05. The two groups had similarities in terms of sex, age, T2DM, and its duration.
|
Table 1. Baseline characteristics of obese and non-obese patients |
|||||
|
Group 1 BMI <30 kg/m² (n=27) |
Group 2 BMI ≥30 kg/m² (n=33) |
p |
|||
|
Male (n=12) |
Female (n=15) |
Male (n=20) |
Female (n=13) |
||
|
Age, years |
65.8 (11.3) |
62.4 (8.9) |
0.21 |
||
|
BP average value, mmHg |
134/86 |
150/90 |
146/90 |
140/84 |
?? |
|
HBA1c, % |
7.5 (2.3) |
6.6 (2.7) |
7.5 (2.1) |
7.3 (0.9) |
0.49 |
|
Total-C, mmol/l |
4.1 (1.6) |
4.7 (1.6) |
4.2 (1.1) |
4.8 (1.1) |
0.97 |
|
TG, mmol/l |
1.9 (1.2) |
2.0 (1.1) |
2.1 (1.3) |
1.7 (1.3) |
0.95 |
|
HDL-C, mmol/l |
1.3 (0.5) |
1.6 (0.6) |
1.5 (0.5) |
1.4 (0.4) |
0.94 |
|
LDL-C, mmol/l |
2.3 (1.0) |
2.6 (1.2) |
2.1 (0.8) |
2.9 (1.2) |
0.83 |
|
Values are shown as mean (standard deviation), except for blood pressure (average) Mann Whitney test BMI - body mass index, BP - blood pressure, HDL-C - high-density lipoprotein cholesterol, LDL-C - low-density lipoprotein cholesterol, Total-C - total cholesterol, TG - triglycerides |
|||||
The average HBA1C levels in males with and without obesity did not differ, according to the study's findings. However, the average HBA1C level in non-obese women was though not significantly lower (6.6 (2.7))% than in obese women (7.3 (0.9))%, (p=0.49).
BP among males with a BMI below 30 kg/m² was significantly (p<0.05) lower than that of males with a BMI of 30 kg/m² or higher. Conversely, the opposite is true for females. The obese group had significantly lower lipid profile readings than the non-obese group, however there were o statistically significant difference.
Relation between obesity and DN
The study's results indicated that obese individuals had a higher rate of kidney injury compared to those who were not obese; notably, microalbuminuria occurred much more often in obese patients (Fig. 1).
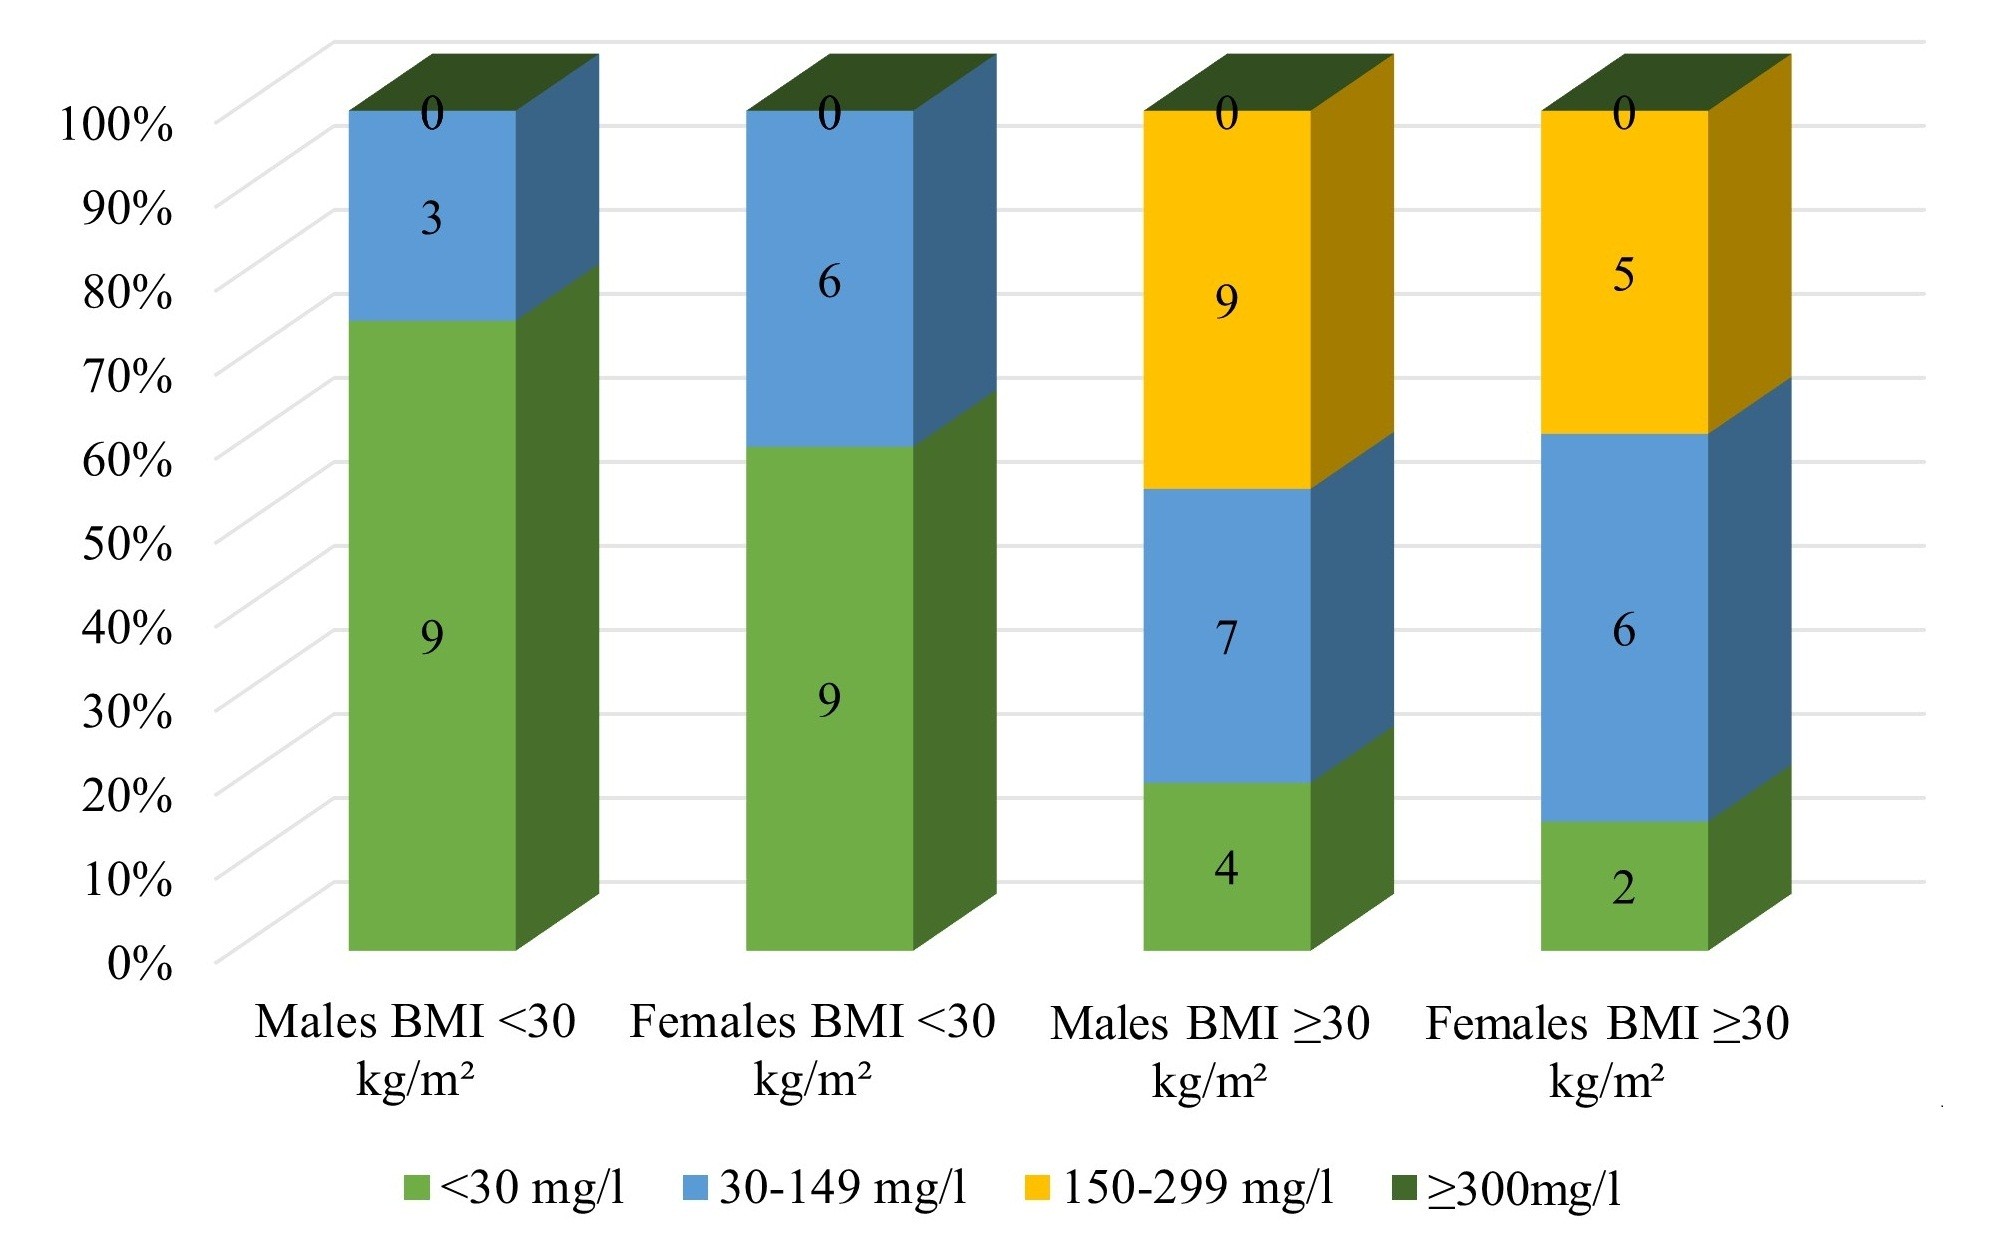
Figure 1. Male and female microalbuminuria levels depending on the degree of obesity
The Mann-Whitney U test found that microalbuminuria was significantly more common in obese subjects than in normal-weight individuals (U = 547.0, p<0.001) (Table 2).
|
Table 2. Microalbuminuria in patients with T2DM with and without obesity |
||||
|
Variables |
Normal weight (n=27) |
Obesity (n=33) |
Mann Whitney U |
p |
|
9 of 27 |
27 of 33 |
547 |
<0.001 |
|
|
T2DM – type 2 diabetes mellitus |
||||
Discussion
Our study findings show that obese people irrespective males or females have a significantly higher risk for DN, which will lead to CKD, than non-obese patients. According to the our study's findings, people who are obese have a higher frequency of renal injury than those who are not.
The three main risk factors for DN are genetic susceptibility, elevated BP, and hyperglycemia (17). The development or progression of several diseases, including diabetes, heart failure, CKD, and neuropsychiatric disorders, has been studied in relation to sex differences. Male patients had a higher risk of CKD progression and death than female patients, according to a recent study from the Chronic Renal Insufficiency Cohort, which comprised 3,939 people (of whom half had diabetes)(18). In a two-sample Mendelian randomized study, Kjaergaard et al. (19) found similar findings when they investigated the direction and causality of the association between kidney function and obesity. In individuals with T2DM, a high BMI was linked to compromised kidney function (19).
Although the lipid profile varies as nephropathy progresses, blood lipids, notably triglycerides (11, 12), are associated with the onset and course of nephropathy (20–22).DN patients have lower levels of HDL apolipoprotein A-I (ApoA-I) and higher plasma concentrations of triglycerides, cholesterol, and lipoproteins linked to apolipoprotein B (ApoB) very low-density lipoproteins, intermediate-density lipoproteins, LDL, and lipoprotein(a) (Lpa) (23). A more profound comprehension of the mechanisms underlying obesity-induced kidney disease is necessary, given the rising incidence of both conditions (8). At both systemic and intrarenal levels, obesity worsens hemodynamic abnormalities that influence kidney function and speed up the progression of sclerotic changes. Lipid metabolism disorders can also be nephrotoxic. However, in our study, there were no significant differences in lipid profile of patients with and without obesity.
Study limitations
Although this study offers encouraging data on the relationship between obesity and CKD in T2DM patients, it has some limitations. It was carried out at a single center with a limited sample size (n=60), which may restrict how broadly the findings apply. Our findings suggest that further research at the molecular level is needed, especially since leptin levels have been associated with a higher risk of CKD.
Conclusion
Based on our data, the development of diabetic nephropathy is significantly affected by presence of obesity in type 2 diabetes mellitus. However, there was no significant association observed between HbA1c, lipid profile, and DN in our study.
Ethics: Informed consent was obtained from patients for all procedures. The study was retrospective and used anonymized data; therefore, the Institutional Ethics Committee of (IHSM) waived the requirement for ethics approval. The study complies with the principles of the Declaration of Helsinki 2024.
Peer-review: External and internal
Conflict of interest: None to declare
Authorship: M.U. and A.Z.M. equally contributed to the study and manuscript preparation and thus fulfilled all authorship criteria.
Acknowledgements and Funding: None to declare.
Statement on A.I.-assisted technologies use: During the preparation of this work, the authors used Grammarly (Grammar check) and QuillBot (Paraphraser) as grammar-checking and paraphrasing tools. After using this tool, the authors reviewed and edited the content as needed and took full responsibility for the content of the published process.
Data and material availability: The datasets generated during and/or analyzed during the current study are available from the corresponding author on reasonable request. Any share should be in frame of fair use with acknowledgement of source and/or collaboration
References
| 1.Harreiter J, Roden M. Diabetes mellitus: definition, classification, diagnosis, screening and prevention (Update 2023). Wien Klin Wochenschr 2023; 135(Suppl 1): 7-17. https://doi.org/10.1007/s00508-022-02122-y PMid:37101021 PMCid:PMC10133036 |
||||
| 2.Facts & figures [Internet]. International Diabetes Federation. [cited 2025 Sept 30]. Available from: URL: https://idf.org/about-diabetes/diabetes-facts-figures/ | ||||
| 3.Diabetes [Internet]. [cited 2025 Sept 30]. Available from: URL: https://www.who.int/news-room/fact-sheets/detail/diabetes | ||||
| 4.Allan M, McCafferty K, Sheaff M, Yaqoob MM. Identification and management of diabetic nephropathy. Medicine 2023; 51: 262-8. https://doi.org/10.1016/j.mpmed.2023.01.005 |
||||
| 5.Thipsawat S. Early detection of diabetic nephropathy in patient with type 2 diabetes mellitus: A review of the literature. Diabetes & Vasc Dis Res 2021; 18: 14791641211058856. https://doi.org/10.1177/14791641211058856 PMid:34791910 PMCid:PMC8606936 |
||||
| 6.Golay A, Ybarra J. Link between obesity and type 2 diabetes. Best Pract & Res Clin Endocrinol & Metabol 2005; 19: 649-63. https://doi.org/10.1016/j.beem.2005.07.010 PMid:16311223 |
||||
| 7.Avgoustou E, Tzivaki I, Diamantopoulou G, Zachariadou T, Avramidou D, Dalopoulos V, et al. Obesity-related chronic kidney disease: from diagnosis to treatment. Diagnostics 2025; 15: 169. https://doi.org/10.3390/diagnostics15020169 PMid:39857056 PMCid:PMC11763674 |
||||
| 8.Arabi T, Shafqat A, Sabbah BN, Ashraf N, Shah H, Abdulkader H, et al. Obesity-related kidney disease: Beyond hypertension and insulin-resistance. Front Endocrinol 2023; 13: doi: 10.3389/fendo.2022.1095211 https://doi.org/10.3389/fendo.2022.1095211 PMid:36726470 PMCid:PMC9884830 |
||||
| 9.Collaborators. Health effects of overweight and obesity in 195 countries over 25 years. New Engl J Med2017; doi: 10.1056/NEJMoa1614362 https://doi.org/10.1056/NEJMoa1614362 PMid:28604169 PMCid:PMC5477817 |
||||
| 10.Kovesdy CP, Furth SL, Zoccali C. World Kidney Day Steering Committee. Obesity and kidney disease: hidden consequences of the epidemic. J Nephrol 2017; 30: 1-10. https://doi.org/10.1007/s40620-017-0377-y PMid:28214961 |
||||
| 11.Sultanalieva RB, Rysbekova GS, Abylova NK, Murzakarimova LK. Epidemiology and burden of diabetes in the world and Kyrgyzstan. Zdravoohraneniye Kyrgyzstan 2022; 4: 19-25. https://doi.org/10.51350/zdravkg2022.4.10.2.19 |
||||
| 12.Garofalo C, Borrelli S, Minutolo R, Chiodini P, Nicola LD, Conte G. A systematic review and meta-analysis suggests obesity predicts onset of chronic kidney disease in the general population. Kidney Intern 2017; 91: 1224-35. https://doi.org/10.1016/j.kint.2016.12.013 PMid:28187985 |
||||
| 13.Levey AS, Eckardt KU, Tsukamoto Y, Levin A, Coresh J, Rossert J, et al. Definition and classification of chronic kidney disease: A position statement from Kidney Disease: Improving Global Outcomes (KDIGO). Kidney Intern 2005; 67: 2089-100. https://doi.org/10.1111/j.1523-1755.2005.00365.x PMid:15882252 |
||||
| 14.World Obesity Federation [Internet]. [cited 2026 Jan 6]. Obesity Classification. Available from: URL: https://www.worldobesity.org/about/about-obesity/obesity-classification | ||||
| 15.Glycated haemoglobin (HbA1c) for the diagnosis of diabetes. In: Use of Glycated Haemoglobin (HbA1c) in the Diagnosis of Diabetes Mellitus: Abbreviated Report of a WHO Consultation [Internet]. World Health Organization; 2011 [cited 2026 Jan 6]. Available from: URL: https://www.ncbi.nlm.nih.gov/books/NBK304271/ | ||||
| 16. Jansson Sigfrids F, Dahlström EH, Forsblom C, Sandholm N, Harjutsalo V, Taskinen M ‐R., et al. Remnant cholesterol predicts progression of diabetic nephropathy and retinopathy in type 1 diabetes. J Intern Med 2021; 290: 632-45. https://doi.org/10.1111/joim.13298 PMid:33964025 |
||||
| 17.Gross JL, de Azevedo MJ, Silveiro SP, Canani LH, Caramori ML, Zelmanovitz T. Diabetic nephropathy: diagnosis, prevention, and treatment. Diabetes Care 2005; 28: 164-76. https://doi.org/10.2337/diacare.28.1.164 PMid:15616252 |
||||
| 18.Wang Y, Zhang J, Zhang J, Wu Y, Zhang R, Ren H, et al. Sex differences in biopsy-confirmed diabetic kidney disease. Front Endocrinol 2021; 12: doi: 10.3389/fendo.2021.670674 https://doi.org/10.3389/fendo.2021.670674 PMid:34393995 PMCid:PMC8360678 |
||||
| 19.Kjaergaard AD, Teumer A, Witte DR, Stanzick KJ, Winkler TW, Burgess S, et al. Obesity and kidney function: a two-sample Mendelian randomization study. Clin Chem 2022; 68: 461-72. https://doi.org/10.1093/clinchem/hvab249 PMid:34922334 PMCid:PMC7614591 |
||||
| 20.Thomas MC, Rosengård-Bärlund M, Mills V, Rönnback M, Thomas S, Forsblom C, et al. Serum lipids and the progression of nephropathy in type 1 diabetes. Diabetes Care 2006; 29: 317-22. https://doi.org/10.2337/diacare.29.02.06.dc05-0809 PMid:16443880 |
||||
| 21.Tolonen N, Forsblom C, Thorn L, Wadén J, Rosengård-Bärlund M, Saraheimo M, et al. Relationship between lipid profiles and kidney function in patients with type 1 diabetes. Diabetologia 2008; 51: 12-20. https://doi.org/10.1007/s00125-007-0858-y PMid:17994214 |
||||
| 22.Tofte N, Suvitaival T, Ahonen L, Winther SA, Theilade S, Frimodt-Møller M, et al. Lipidomic analysis reveals sphingomyelin and phosphatidylcholine species associated with renal impairment and all-cause mortality in type 1 diabetes. Sci Rep 2019; 9: 16398. https://doi.org/10.1038/s41598-019-52916-w PMid:31705008 PMCid:PMC6841673 |
||||
| 23.Kawanami D, Matoba K, Utsunomiya K. Dyslipidemia in diabetic nephropathy. Ren Replace Ther 2016; 2: 16. https://doi.org/10.1186/s41100-016-0028-0 |
||||
Copyright

This work is licensed under a Creative Commons Attribution-NonCommercial 4.0 International License.
AUTHOR'S CORNER
