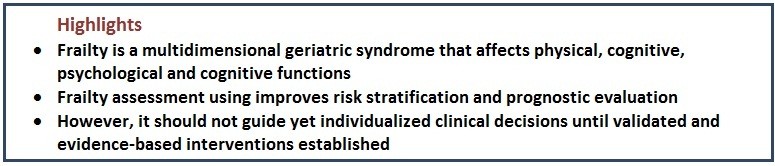
Frailty assessment and management using the frailty index: A narrative review
REVIEW
Frailty assessment and management using the frailty index: A narrative review
Article Summary
- DOI: 10.24969/hvt.2026.630
- CARDIOVASCULAR DISEASES
- Published: 04/03/2026
- Received: 26/01/2026
- Revised: 22/02/2026
- Accepted: 23/02/2026
- Views: 1249
- Downloads: 874
- Keywords: Frailty, frailty index, frailty phenotype, Clinical Frailty Scale, sarcopenia, cardiovascular-kidney-metabolic syndrome
Address for Correspondence: Samir Rafla, Department of Cardiology Faculty of Medicine, Alexandria University, Alexandria, Egypt
E-mail: smrafla@yahoo.com
ORCID: Samir Rafla - 0000-0001-8688-6532; Marwa Saad - 0000-0002-8177-1055; Amr Salama - 0000 0001 5966 6534;
Mohamed Saeed Elhoshy - 0009-0001-2442-3644
Samir Rafla1a*, Marwa Saad1b, Amr Salama1b, Mohamed Saeed Elhoshy1c
1a Department of Cardiology and 1bDepartment of Medicine (geriatrics unit), Faculty of Medicine, Medical Research Institute1c, Alexandria University, Alexandria, Egypt
Abstract
Objective: To provide a comprehensive overview of frailty assessment instruments and evaluate their clinical applicability and prognostic value across healthcare settings.
Methods: A structured literature search was conducted in PubMed/MEDLINE, Scopus, and Web of Science for studies published between January 2000 and January 2025. Keywords included “frailty,” “frailty index,” “frailty phenotype,” “Clinical Frailty Scale,” “electronic frailty index,” and related terms. Peer-reviewed studies evaluating frailty measurement tools and their associations with clinical outcomes in adult populations were included. Titles and abstracts were screened for relevance, followed by full-text review. Due to heterogeneity in study designs and outcome measures, findings were synthesized narratively.
Results: Frailty is operationalized using multiple conceptual models, primarily the phenotype-based approach and the cumulative deficit model. Additional instruments, including clinical bedside scales and claims- or electronic health record–based indices, have been developed to enhance feasibility and scalability. Across diverse populations and clinical settings, frailty consistently predicts adverse outcomes, including mortality, hospitalization, postoperative complications, prolonged length of stay, and healthcare expenditures. However, substantial heterogeneity exists in definitions, thresholds, and implementation strategies, limiting direct comparability across studies. No single instrument demonstrates universal superiority across all contexts.
Conclusion: Frailty assessment is a robust predictor of adverse clinical outcomes and represents an important tool for risk stratification. Nevertheless, variability in measurement approaches underscores the need for methodological standardization and prospective validation. Future research should determine whether frailty-guided interventions can translate prognostic identification into improved patient outcomes.
Key words: Frailty, frailty index, frailty phenotype, Clinical Frailty Scale, sarcopenia, cardiovascular-kidney-metabolic syndrome
Abbreviations:
CHARLS - China Health and Retirement Longitudinal Study
CKD - chronic kidney disease
CKM – Cardiovascular-kidney-metabolic syndrome
CVD - cardiovascular disease
FI - Frailty Index
FP - Frailty Phenotype
Graphical abstract
Introduction
Definition
Frailty is a complex, multidimensional condition characterized by increased vulnerability to stressors due to cumulative declines across multiple physiological systems. It is most commonly observed in older adults and can manifest in physical, cognitive, social, and psychological domains (1, 2).
While these types of frailty may or may not coexist, they collectively contribute to an individual's overall frailty status. In recent years, researchers have developed integrated conceptual models to capture frailty's multifactorial nature better, acknowledging that frailty is not solely a consequence of aging but rather the result of dynamic interactions among various systems (3, 9-62).
Prevalence: Prevalence varies by operational definition and age-
•7% prevalence (3, 9),
•25% prevalence reported by (4-5, 21, 22),
•10-25% prevalence in individuals over 65 years old,
•30-45% prevalence in individuals over 85 years old,
•33% prevalence among in-hospital admissions (24).
Methods
A structured literature search was conducted in PubMed/MEDLINE, Scopus, and Web of Science to identify relevant studies on frailty measurement, frailty indices, and their clinical applications. The search covered publications from January 2000 to January 2025 (9-62).
Inclusion Criteria
Studies were included if they:
•Were published in peer-reviewed journals,
•Involved human adults (≥60 years),
•Evaluated frailty assessment tools,
•Examined clinical outcomes (mortality, hospitalization, surgery, costs),
•Were written in English.
Studies were excluded if they:
•Were conference abstracts without full text,
•Focused exclusively on pediatric populations,
• Were animal or laboratory-only studies.
Study Selection
Titles and abstracts were screened for relevance. Full-text articles were reviewed for eligibility based on the inclusion and exclusion criteria.
•Data Synthesis
•Given the heterogeneity of frailty instruments and study designs, findings were synthesized narratively rather than through meta-analysis.
Conceptual models of frailty
(Phenotype vs. deficit accumulation)
The frailty phenotype model introduced by Linda Fried (9) conceptualizes frailty as a biological syndrome characterized by measurable physical components. It has strong predictive validity for mortality and disability.
The cumulative deficit model developed by Kenneth Rockwood (21, 22) operationalizes frailty as the proportion of accumulated health deficits. It demonstrates graded risk prediction across multiple outcomes and settings.
Both models:
•Predict mortality
•Predict hospitalization
•Demonstrate reproducibility across populations
Critical Appraisal
•The phenotype model may oversimplify frailty by emphasizing physical domains while underrepresenting cognitive and psychosocial dimensions.
•The deficit accumulation model is statistically robust but may lack biological specificity.
•Operational thresholds differ across studies, affecting prevalence estimates.
Knowledge Gaps
•Lack of consensus on a unifying biological framework.
•Limited mechanistic studies linking frailty indices to molecular pathways.
•Unclear whether one model performs superiorly in specific subspecialties (e.g., cardiology vs oncology).
Cardiovascular-kidney-metabolic syndrome (CKM)-related evidence: Outcome and risk studies
Evidence from Cardiovascular Outcome Studies: A growing body of observational and longitudinal studies demonstrates that frailty is independently associated with adverse cardiovascular outcomes across populations with metabolic dysfunction, early chronic kidney disease (CKD), and subclinical cardiovascular disease (CVD) —key components of CKM stages 1–3. In community-based cohorts, frailty and prefrailty have been linked to increased incidence of major adverse cardiovascular events, including myocardial infarction, stroke, heart failure hospitalization, and cardiovascular mortality, even after adjustment for traditional cardiometabolic risk factors such as hypertension, diabetes, and dyslipidemia (6,10,16–19).
•Importantly, several studies suggest that the prognostic impact of frailty is evident prior to overt cardiovascular disease, aligning with early CKM stages. In populations with metabolic syndrome or insulin resistance but no established CVD, frailty has been associated with accelerated progression to clinical cardiovascular endpoints, indicating that frailty may function as an early vulnerability marker rather than merely a consequence of advanced disease (17, 20, 21). Similarly, among individuals with mild to moderate CKD (stages 1–3), frailty has been shown to predict cardiovascular events and mortality independent of estimated glomerular filtration rate and albuminuria, underscoring its added prognostic value beyond traditional kidney measures (9, 22–24).
•Emerging evidence also suggests that frailty progression, rather than baseline frailty status alone, may be particularly relevant to cardiovascular outcomes. Longitudinal analyses have demonstrated that worsening frailty trajectories are associated with higher rates of incident CVD and heart failure, whereas frailty stability or improvement is linked to more favorable outcomes (18, 25).
These findings are especially pertinent within the CKM framework, where early identification of accelerating vulnerability could enable earlier preventive intervention.
Evidence from risk and prognostic studies
•Beyond hard cardiovascular endpoints, numerous studies have examined frailty as a predictor of cardiometabolic and renal risk states that precede overt CVD. Frailty has been associated with higher prevalence and incidence of hypertension, type 2 diabetes, central obesity, systemic inflammation, and insulin resistance—core drivers of CKM stage 1 and 2 progression (6,11,16,26). These associations persist even in younger and middle-aged populations, suggesting that frailty-related vulnerability is not confined to advanced age.
•Risk modeling studies indicate that frailty measures improve cardiovascular risk prediction when added to conventional risk scores, particularly in individuals with early CKD or metabolic dysfunction but without established CVD (10, 23). In CKD stage 1–3 populations, frailty has been linked to faster decline in kidney function, increased albuminuria, and heightened vascular stiffness, all of which contribute to elevated cardiovascular risk within the CKM continuum (9, 22, 27).
•Importantly, frailty appears to capture nontraditional risk pathways—including sarcopenia, autonomic dysfunction, chronic inflammation, and impaired stress response—that are not fully reflected in standard cardiometabolic biomarkers. This may explain why frailty is consistently associated with adverse outcomes even after extensive multivariable adjustment (6, 9, 10). Within early CKM stages, these subclinical mechanisms may represent a critical window during which frailty progression amplifies cardiovascular vulnerability before irreversible organ damage occurs.
Implications for early CKM stages (1–3)
Taken together, outcome and risk studies support the concept that frailty is both a marker and mediator of cardiovascular risk within the early phases of CKM syndrome. While much of the existing literature has focused on older adults or advanced disease states, accumulating evidence indicates that frailty-related risk emerges earlier in the CKM trajectory and may accelerate transitions from metabolic and renal dysfunction to overt cardiovascular disease.
•However, significant gaps remain. Most studies rely on single-time-point frailty assessments, limiting insight into how frailty progression or improvement modifies cardiovascular risk over time in CKM stages 1–3. Additionally, heterogeneity in frailty definitions and limited CKM-specific stratification complicate direct comparisons across studies. Addressing these gaps is essential to clarify the prognostic role of frailty dynamics and to inform risk-stratification strategies in early CKM populations.
Sarcopenia overview
Sarcopenia is a progressive, age-related condition characterized by declines in skeletal muscle mass, muscular strength, and physical performance. Beginning in early adulthood, skeletal muscle mass decreases gradually at an estimated rate of several percent per decade, with the pace of decline accelerating after the sixth decade of life. When sarcopenia coexists with excess adiposity, the condition is often described as “fat-frail,” reflecting the combined burden of reduced muscle function and increased metabolic risk.
Clinically, sarcopenia contributes substantially to functional impairment, loss of independence, increased fall risk, and delayed recovery following acute or chronic illness.
Population-based estimates suggest that a significant proportion of adults aged 65 years and older are affected, underscoring its relevance as a public health concern. In addition to its clinical consequences, sarcopenia imposes a considerable economic burden on healthcare systems, with costs projected to rise in parallel with population aging.
Assessment of sarcopenia frequently relies on imaging-based measures of body composition, such as dual-energy X-ray absorptiometry, in conjunction with indices like the relative skeletal muscle index. Given the modifiable nature of muscle mass and function, effective management often requires interdisciplinary approaches that integrate nutritional optimization and structured physical activity interventions.
Assessment of Frailty
Frailty was quantified using the Frailty Index (FI), an established measure based on the cumulative accumulation of health deficits. This approach, originally developed by Rockwood and colleagues (21, 22), conceptualizes frailty as a continuum reflecting the proportion of age-related deficits present within an individual (2, 7). Subsequent studies have refined and validated this methodology across diverse populations (7, 8).
In the present analysis, the FI was constructed using 30 variables derived from the China Health and Retirement Longitudinal Study (CHARLS). These variables encompassed multiple health domains, including chronic conditions (excluding stroke and heart disease), functional limitations, physical performance, psychological symptoms, and cognitive status. Most items were coded dichotomously to indicate the presence or absence of a deficit, while cognitive function was represented as a graded variable ranging from 0 to 1.
The overall FI score was calculated by dividing the number of identified deficits by the total number of items, producing a continuous value between 0 and 1, with higher scores indicating greater frailty. Changes in frailty over time were evaluated using FI measurements obtained across successive follow-up waves. Based on established thresholds, participants were categorized as robust, pre-frail, or frail (2, 4, 7, 10).
30-Item Frailty Index checklist
The 30-item Frailty Index checklist assesses a broad range of health domains, including cognitive function, chronic medical conditions, mobility, sensory function, functional independence, and nutrition. Each item is scored as 0 (not present) or 1 (present), consistent with the deficit accumulation approach (2, 7). The total number of deficits accumulated by an individual determines their frailty score, with higher scores indicating greater frailty (2).
1. Cognitive & Mental Function
1. Memory problems
2. Difficulty concentrating
3. Depression or low mood
4. Anxiety or nervousness
5. Diagnosed dementia or cognitive impairment
2. Chronic Medical Conditions
6. History of myocardial infarction (heart attack)
7. Congestive heart failure
8. Diabetes mellitus
9. Hypertension
10. Chronic kidney disease or renal insufficiency
11. Chronic obstructive pulmonary disease (COPD) or asthma
12. Stroke or transient ischemic attack (TIA)
13. Peripheral vascular disease
14. Osteoporosis
15. Cancer (active or history of)
3. Mobility & Physical Performance
16. Difficulty walking (even with aid)
17. Frequent falls (≥2 in past year)
18. Use of walking aid (e.g., cane, walker)
19. Difficulty rising from a chair or bed
20. Slow gait speed (clinically assessed or perceived)
21. Decreased grip strength or weakness
4. Sensory & Communication
22. Uncorrected visual impairment
23. Uncorrected hearing impairment
24. Difficulty communicating (speech or comprehension)
5. Functional Independence
25. Difficulty bathing
26. Difficulty dressing
27. Difficulty eating or feeding oneself
28. Difficulty with toileting
29. Difficulty managing medications or finances
6. General Health & Nutrition
30. Unintentional weight loss (>5% in 6–12 months)
Scoring and interpretation (Table 1)
|
Table 1. Scoring and Interpretation of frailty index |
||
|
Total Deficits |
Frailty Grade |
Interpretation |
|
0–7 |
Grade 1 – Mild |
Mild frailty |
|
8–14 |
Grade 2 – Moderate |
Moderate frailty |
|
≥15 |
Grade 3 – Severe |
Severe frailty |
Alternative assessment: Frailty Phenotype
An alternative to the Frailty Index, and one that is widely used in clinical and research settings, is the Frailty Phenotype (FP) introduced by Fried and colleagues (9). This model defines frailty as a distinct clinical syndrome diagnosed based on the presence of at least three of the following five criteria:
1. Weakness (measured by low grip strength)
2. Slowness (measured by slow walking speed)
3. Low physical activity level
4. Self-reported exhaustion
5. Unintentional weight loss
Individuals who meet one or two criteria are categorized as pre-frail, while those meeting three or more are classified as frail. This phenotype is particularly useful for identifying frailty in its early stages, with a primary focus on physical and functional health (1-3).
Scoring and interpretation
Frailty severity is commonly categorized based on the number of deficits present, allowing for stratification into mild, moderate, and severe frailty states (13, 14, 18-30). The Frailty Index score is calculated by dividing the total number of deficits by the number of items assessed, yielding a continuous value ranging from 0 (no frailty) to 1 (maximum frailty) (11). This quantitative approach provides a robust estimate of frailty severity and has been shown to correlate strongly with adverse outcomes, including mortality and hospitalization (2, 9).
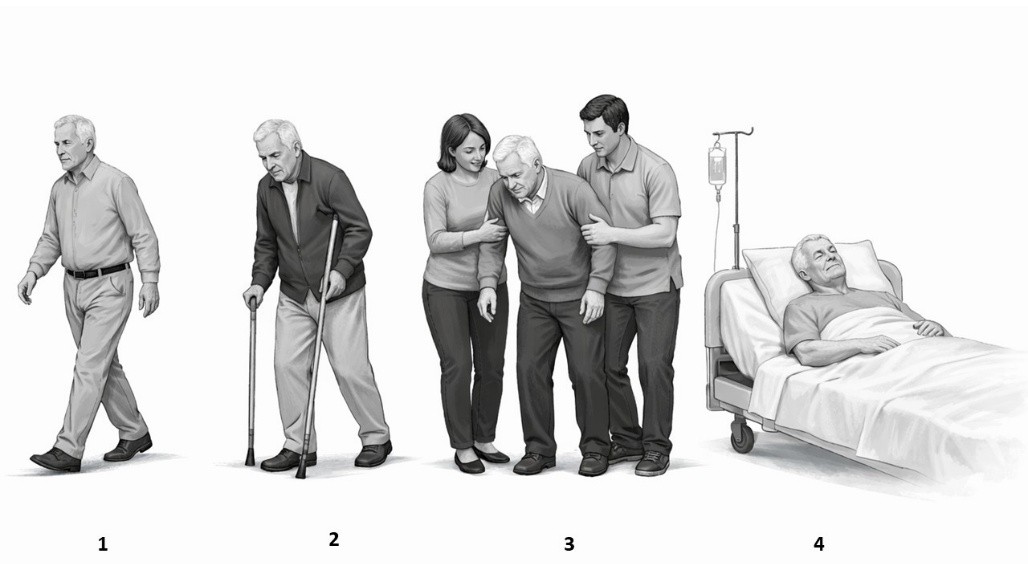
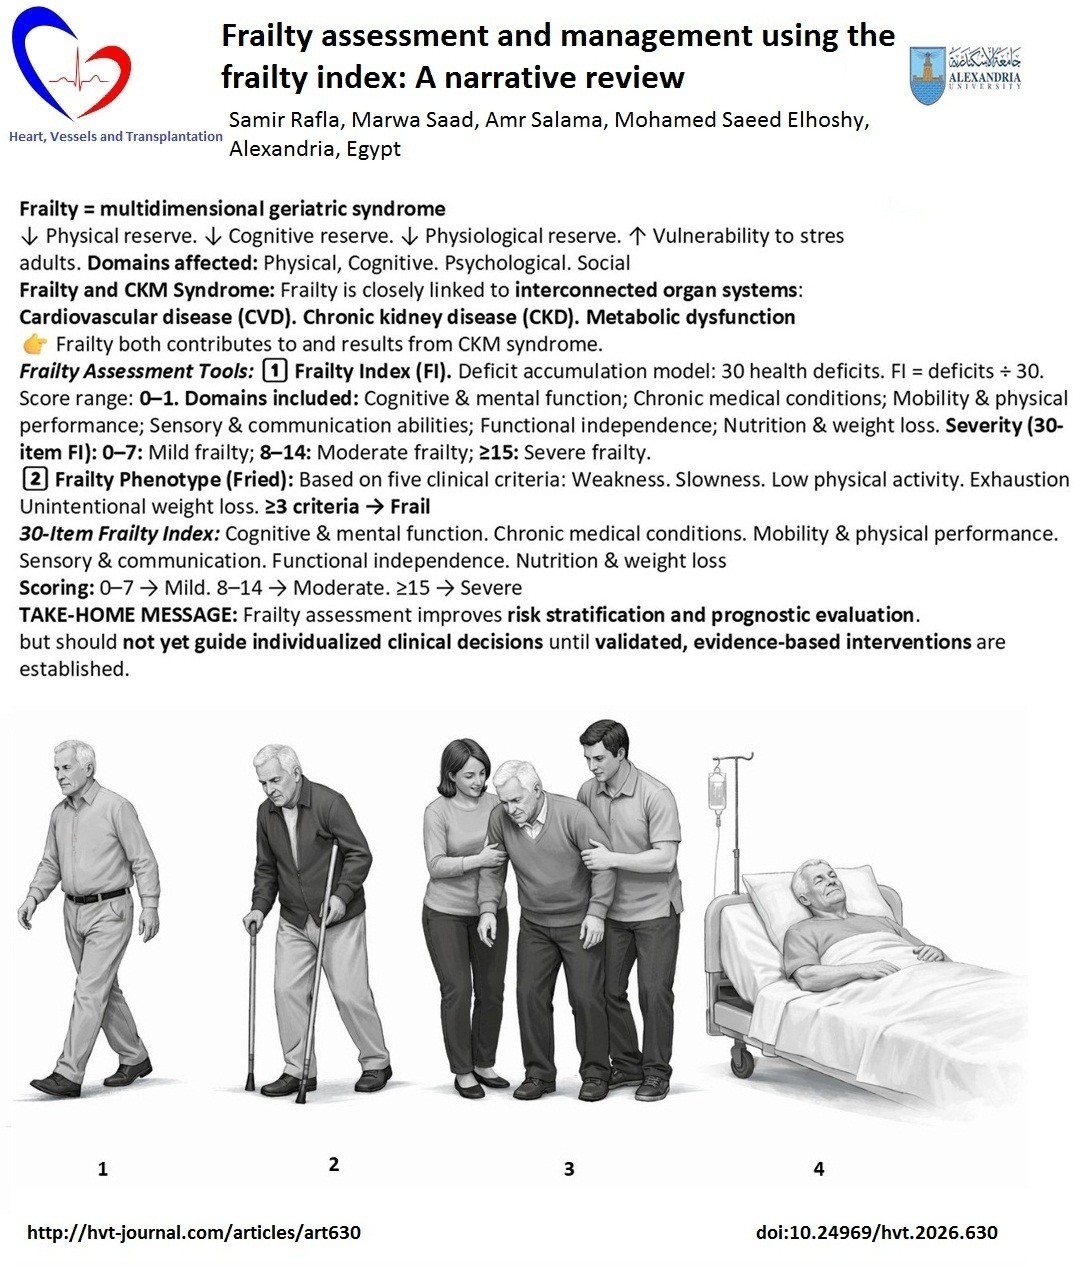
Figure 1. Diagram expressing grades of frailty
(prepared by AI)
Figure 1 illustrates the stages of frailty progression in older adults:
1. Independent walking (Fit)– low prevalence, low risk of adverse outcomes.
2. Cane-assisted walking (pre-Frailty)– Stage 2 (cane-assisted walking) was observed in 35% of the cohort, with a hazard ratio for mortality of 1.5 (95% CI: 1.2–1.8).
3. Caregiver support (Frailty)– high prevalence; high risk for hospitalization and mortality.
4. Bedridden / hospitalized (End-stage Frailty) – low prevalence; very high risk of adverse outcomes.
The primary objective is to strengthen physiological reserve to enhance resilience, reduce susceptibility to stressors, and support recovery from physiological injury. Preventing or minimizing exposure to stressors is also essential. In individuals who are not frail, clinical management should focus on building physiological reserve through healthy lifestyle behaviors, effective control of chronic conditions, and appropriate preventive healthcare strategies.
Clinical Frailty Scale (22)
1.Very fit: Individuals who are robust, highly active, energetic, and motivated.
2.Fit: Individuals without active disease symptoms, though with slightly reduced fitness compared to the very fit group.
3.Managing well: Individuals with well-controlled medical conditions who may experience occasional symptoms and are generally not physically active beyond routine walking.
4.Living with very mild frailty: Represents the early shift away from full independence. Although individuals do not require daily assistance, symptoms often restrict activity levels.
5.Living with mild frailty: Characterized by noticeable slowing and the need for help with complex instrumental activities of daily living, such as financial management, transportation, and heavy household work.
6.Living with moderate frailty: Individuals require assistance with activities outside the home and with household responsibilities.
7.Living with severe frailty: Individuals are fully dependent on others for personal care due to physical or cognitive impairment.
8.Living with very severe frailty: Individuals are completely dependent for personal care and are typically nearing the end of life.
9.Terminally ill: Individuals with a life-limiting illness who are approaching the end of life.
10.Frailty Assessment in Individuals with Dementia (21).
The severity of frailty generally parallels the progression of dementia. In mild dementia, individuals may forget recent information while retaining awareness of the event itself, frequently repeat questions or stories, and exhibit reduced social engagement. Moderate dementia is characterized by marked impairment in recent memory, with relatively preserved recall of long-term autobiographical events. In severe dementia, individuals are unable to perform personal care activities independently. Those with very severe dementia are often bedridden and require complete assistance with all activities of daily living.
Comparison of two frailty scoring systems (Table 2)
|
Table 2. Comparison between the Frailty Index and the Frailty Phenotype |
||
|
Feature |
Frailty Index (FI) |
Frailty Phenotype (FP) |
|
Conceptual model |
Deficit accumulation model |
Biological/physical phenotype model |
|
Original developers |
Rockwood et al. |
Fried et al. |
|
Core principle |
Frailty reflects the cumulative burden of health deficits |
Frailty is a clinical syndrome characterized by specific physical features |
|
Number of components |
Variable (typically 30–70 deficits) |
Fixed (5 criteria) |
|
Components included |
Symptoms, signs, diseases, disabilities, cognitive impairment, and laboratory abnormalities |
Unintentional weight loss, exhaustion, weakness (grip strength), slowness (walking speed), low physical activity |
|
Scoring method |
Ratio of deficits present to total deficits assessed (score 0–1) |
Categorical: robust (0), pre-frail (1–2), frail (≥3) |
|
Frailty severity |
Continuous scale allowing gradation of frailty severity |
Ordinal categories only |
|
Focus |
Multidimensional (physical, cognitive, functional, comorbidities) |
Primarily physical frailty |
|
Ease of use |
More time-consuming; requires comprehensive data |
Simpler and faster to apply |
|
Reproducibility across settings |
May vary depending on the deficits included |
Highly standardized |
|
Sensitivity to change over time |
High |
Moderate |
|
Predictive value |
Strong predictor of mortality, hospitalization, and institutionalization |
Strong predictor of disability, falls, and mortality |
|
Use in population studies |
Widely used |
Widely used |
|
Use in individual clinical decision-making |
Informative but complex; not practical for routine bedside use alone |
More feasible clinically but limited in scope |
|
Main limitations |
Complexity, lack of standardization in deficit selection |
A narrow focus may miss cognitive and psychosocial frailty |
|
Best application |
Research, epidemiology, and comprehensive geriatric assessment |
Clinical screening, physical frailty identification |
The Edmonton Frail Scale
(The Edmonton Frail Scale (EFS) (30) is a brief, validated screening tool used to assess frailty in older adults, especially in clinical and preoperative settings. It is practical, easy to administer, and does not require specialized geriatric training.
Overview
• Developed at: University of Alberta
• Primary use: Identify frailty in older adults (typically age 65+)
• Administration time: ~5 minutes
• Who can administer it: Any trained healthcare
provider (nurse, physician, allied health professional).
Domains Assessed (9 total)
The EFS evaluates multiple dimensions of health:
1. Cognition (clock-drawing test)
2. General health status
3. Functional independence
4. Social support
5. Medication use
6. Nutrition
7. Mood
8. Continence
9. Functional performance (Timed Up and Go test)
Scoring
• Score range: 0–17
• Higher scores indicate greater frailty.
Score interpretation
0–4 Not frail
5–6 Apparently vulnerable
7–8 Mild frailty
9–10 Moderate frailty
11–17 Severe frailty
Strengths
• Multidimensional (not just physical frailty)
• Quick and practical
• Validated in acute care and surgical populations
• Includes objective (performance-based) and subjective components
Limitations
• Screening tool — not a comprehensive geriatric assessment
• May require patient participation (less suitable in severe cognitive impairment)
• Some subjectivity in self-reported domains
Management of frailty
Principles of frailty management are as follows:
1. Identification and management of reversible contributors to frailty
• Evaluate and treat acute illnesses, anemia, depression, infections, pain, sensory deficits, and endocrine disorders.
2. Encouragement of physical activity and exercise
• Promote regular aerobic, resistance, balance, and flexibility training to maintain strength, mobility, and reduce fall risk.
3. Nutritional evaluation and support
• Provide dietary counseling
• Ensure sufficient protein and caloric intake
• Supplement vitamins and minerals when clinically indicated (e.g., vitamin D, calcium, vitamin B12)
4. Rehabilitation interventions
• Utilize physical, occupational, and speech therapy as needed
• Emphasize functional independence and quality of life
5. Comprehensive medication assessment
• Identify and reduce polypharmacy
• Avoid potentially inappropriate medications
• Adjust dosages based on renal and hepatic function
• Simplify treatment regimens to enhance adherence
6. Preventive healthcare measures
• Administer recommended vaccinations (e.g., influenza, pneumococcal, herpes zoster, COVID• 19)
• Implement fall prevention strategies, including assistive devices when necessary
• Screen for and manage osteoporosis
7. Cancer screening
• Tailor screening decisions to life expectancy, functional status, comorbidities, and patient preferences
8. Psychosocial and cognitive support
• Screen for depression, delirium, and dementia
• Address social support needs, caregiver stress, and risks of elder abuse
9. Advance care planning
• Discuss goals of care, advance directives, and end-of-life wishes.
Discussion
This review specifically examined the two most established and methodologically robust approaches to frailty assessment: the Frailty Index and the Frailty Phenotype. These models represent the dominant conceptual frameworks underpinning contemporary frailty research and clinical application (32-62).
The FP defines frailty as a clinical syndrome characterized by measurable physical criteria reflecting diminished physiologic reserve. In contrast, the FI conceptualizes frailty as the cumulative accumulation of health deficits across multiple domains, generating a continuous risk score.
Although derived from different theoretical perspectives, both models converge on the same fundamental principle: frailty represents increased biological vulnerability to stressors.
The literature consistently demonstrates that both FI and FP independently predict mortality, hospitalization, postoperative complications, disability, and healthcare utilization across diverse populations. The apparent differences between the two instruments are methodological rather than conceptual. The FP offers simplicity, biological clarity, and suitability for clinical screening and interventional research. The FI provides graded risk stratification and multidimensional depth, making it particularly valuable for prognostic modeling and population-based analyses.
Our analysis clarifies that the ongoing debate in the literature does not reflect uncertainty about the existence or validity of frailty as a construct, but rather differences in operational emphasis between these two complementary models. When appropriately applied according to clinical or research objectives, both FI and FP provide coherent and reliable quantification of frailty.
Conclusions
Frailty is a definable, measurable, and clinically meaningful state of vulnerability. The Frailty Index and the Frailty Phenotype constitute the two principal and evidence-based frameworks for its assessment. Rather than representing competing definitions, these models provide complementary approaches to measuring the same multidimensional construct. The FP is particularly suited to bedside clinical identification of frailty as a syndrome, whereas the FI enables refined risk stratification across broader healthcare settings.
This review establishes a structured interpretation of frailty assessment, explicitly grounded in these two validated models. Selection between FI and FP should therefore be guided by context and intended application, ensuring methodological alignment with clinical or research goals.
Peer-review: External and internal
Conflict of interest: None to declare
Authorship: S.R. wrote the paper, revised the grammar and plagiarism, added references, and submitted the paper; M.S. revised the paper and improved the data; A.S. revised the paper and improved the data; M.S.E. revised the paper and improved the data. All authors approved revised version for publication, thus equally contributed to preparation of manuscript and fulfilled all authorship criteria
Acknowledgements and funding: None to declare
Statement on A.I.-assisted technologies use: The authors used AI technology in preparation of figure.
Data and material availability: Does not apply
References
| 1.Akner G. Critical appraisal of the concept of frailty: Rating of frailty in elderly people has a weak scientific basis and should not be used for managing individual patients. Aging Dis 2023; 14: 21-4. doi:10.14336/AD.2022.0506 https://doi.org/10.14336/AD.2022.0506 PMid:36818552 PMCid:PMC9937708 |
||||
| 2.Blodgett JM, Rockwood K, Theou O. Changes in the severity and lethality of age-related health deficit accumulation in the USA between 1999 and 2018: A population-based cohort study. Lancet Healthy Longev 2021; 2: e96-e104. doi:10.1016/S2666-7568(20)30057-2 https://doi.org/10.1016/S2666-7568(20)30059-3 PMid:36098163 PMCid:PMC8220351 |
||||
| 3.Boucham M, Salhi A, El Hajji N, Gbenonsi GY, Belyamani L, Khalis M. Factors associated with frailty in older people: An umbrella review. BMC Geriatr 2024; 24: 737. doi:10.1186/s12877-024-05288-4 https://doi.org/10.1186/s12877-024-05288-4 PMid:39237866 PMCid:PMC11376099 |
||||
| 4.Boucher EL, Gan JM, Rothwell PM, Shepperd S, Pendlebury ST. Prevalence and outcomes of frailty in unplanned hospital admissions: A systematic review and meta-analysis of hospital-wide and general (internal) medicine cohorts. eClinicalMedicine 2023; 59: 101947. doi:10.1016/j.eclinm.2023.101947 https://doi.org/10.1016/j.eclinm.2023.101947 PMid:37138587 PMCid:PMC10149337 |
||||
| 5.Cesari M, Gambassi G, Abellan van Kan G, Vellas B. The frailty phenotype and the frailty index: Different instruments for different purposes. Age Ageing 2014; 43: 10-2. doi:10.1093/ageing/aft160 https://doi.org/10.1093/ageing/aft160 PMid:24132852 |
||||
| 6.Dent E, Hanlon P, Kowal P, Hoogendijk EO. Frailty measurement in research and clinical practice: An updated review. Eur J Intern Med 2025; 20: 106595. doi:10.1016/j.ejim.2025.106595 https://doi.org/10.1007/s11739-022-03042-5 PMid:35864373 PMCid:PMC9302874 |
||||
| 7.Fehlmann CA, Nickel CH, Cino E, Al-Najjar Z, Langlois N, Eagles D. Frailty assessment in emergency medicine using the Clinical Frailty Scale: A scoping review. Intern Emerg Med 2022; 17: 2407-18. doi:10.1007/s11739-022-03042-5 | ||||
| 8.Fierro-Marrero J, Reina-Varona Á, Paris-Alemany A, La Touche R. Frailty in Geriatrics: A critical review of instruments and challenges. J Clin Med 2025; 14: 1808. doi:10.3390/jcm14061808 https://doi.org/10.3390/jcm14061808 PMid:40142616 PMCid:PMC11943423 |
||||
| 9.Fried LP, Tangen CM, Walston J, Newman AB, Hirsch C, Gottdiener J, et al.; Cardiovascular Health Study Collaborative Research Group. Frailty in older adults: Evidence for a phenotype. J Gerontol A Biol Sci Med Sci 2001; 56: M146-56. doi:10.1093/gerona/56.3.M146 https://doi.org/10.1093/gerona/56.3.M146 PMid:11253156 |
||||
| 10.Gobbens RJ, Luijkx KG, Wijnen-Sponselee MT, Schols JM. Towards an integrated conceptual model of frailty. J Nutr Health Aging 2010; 14: 175-81. doi:10.1007/s12603-010-0045-6 https://doi.org/10.1007/s12603-010-0045-6 PMid:20191249 PMCid:PMC12878858 |
||||
| 11.Hoogendijk EO, Dent E. Trajectories, transitions, and trends in frailty among older adults: A review. Ann Geriatr Med Res 2022; 26: 289-95. doi:10.4235/agmr.22.0148 https://doi.org/10.4235/agmr.22.0148 PMid:36503183 PMCid:PMC9830071 |
||||
| 12.Kane AE, Howlett SE. Sex differences in frailty: Comparisons between humans and preclinical models. Mech Ageing Dev 2021; 198: 111546. doi:10.1016/j.mad.2021.111546 https://doi.org/10.1016/j.mad.2021.111546 PMid:34324923 |
||||
| 13.Kasiukiewicz A, Wojszel ZB. The prevalence of the frailty syndrome in a hospital setting-is its diagnosis a challenge? A comparison of four frailty scales in a cross-sectional study. J Clin Med 2023; 13: 86. doi:10.3390/jcm13010086 https://doi.org/10.3390/jcm13010086 PMid:38202093 PMCid:PMC10780177 |
||||
| 14.Kojima G, Iliffe S, Walters K. Frailty index as a predictor of mortality: A systematic review and meta-analysis. Age Ageing 2018; 47: 193-200. doi:10.1093/ageing/afx162 https://doi.org/10.1093/ageing/afx162 PMid:29040347 PMCid:PMC10563353 |
||||
| 15.Lewis M, Heymann A, Zacay G, Justo D. Frailty and its association with long-term mortality among community-dwelling older adults aged 75 years and over. Isr J Health Policy Res 2024; 13: 26. doi:10.1186/s13584-024-00614-y https://doi.org/10.1186/s13584-024-00614-y PMid:39010194 PMCid:PMC11251321 |
||||
| 16.Money A, MacKenzie A, Parchment A, Norman G, Harris D, Ahmed S, et al. Evidence on non-pharmacological interventions for preventing or reversing frailty. BMC Geriatr 2025; 25: 183. doi:10.1186/s12877-025-05768-1 https://doi.org/10.1186/s12877-025-05768-1 PMid:40097929 PMCid:PMC11912688 |
||||
| 17.Ndumele CE, Rangaswami J, Chow SL, Neeland IJ, Tuttle KR, Khan SS, et al. Cardiovascular-kidney-metabolic health: A presidential advisory from the American Heart Association. Circulation 2023; 148: 1606-35. doi:10.1161/CIR.0000000000001184 https://doi.org/10.1161/CIR.0000000000001184 PMid:37807924 PMCid:PMC11732953 |
||||
| 18.Nicholson C, Gordon AL, Tinker A. Changing the way "we" view and talk about frailty. Age Ageing 2016; 46: 349-51. doi:10.1093/ageing/afw224 https://doi.org/10.1093/ageing/afw224 PMid:27932367 |
||||
| 19.Pridham G, Rockwood K, Rutenberg A. Strategies for handling missing data that improve Frailty Index estimation and predictive power: Lessons from the NHANES dataset. GeroScience 2022; 44: 897-923. doi:10.1007/s11357-021-00489-w https://doi.org/10.1007/s11357-021-00489-w PMid:35103915 PMCid:PMC9135945 |
||||
| 20.Pulok MH, Theou O, van der Valk AM, Rockwood K. The role of illness acuity on the association between frailty and mortality in emergency department patients referred to internal medicine. Age Ageing 2020; 49: 1071-9. doi:10.1093/ageing/afaa089 https://doi.org/10.1093/ageing/afaa089 PMid:32392289 PMCid:PMC7583513 |
||||
| 21.Rockwood K, Song X, MacKnight C, Bergman H, Hogan DB, McDowell I, et al. A standard procedure for creating a measure of fitness and frailty in elderly people. CMAJ 2005; 173: 489-95. doi:10.1503/cmaj.050051 https://doi.org/10.1503/cmaj.050051 PMid:16129869 PMCid:PMC1188185 |
||||
| 22.Rockwood K, Theou O. Using the Clinical Frailty Scale in allocating scarce health care resources. Can Geriatr J 2020; 23: 210-5. doi:10.5770/cgj.23.463 https://doi.org/10.5770/cgj.23.463 PMid:32904824 PMCid:PMC7458601 |
||||
| 23.Searle SD, Mitnitski A, Gahbauer EA, Gill TM, Rockwood K. A standard procedure for creating a frailty index. BMC Geriatr 2008; 8: 24. doi:10.1186/1471-2318-8-24 https://doi.org/10.1186/1471-2318-8-24 PMid:18826625 PMCid:PMC2573877 |
||||
| 24.Shi SM, McCarthy EP, Mitchell S, Kim DH. Changes in predictive performance of a frailty index with the availability of clinical domains. J Am Geriatr Soc 2020; 68: 1771-7. doi:10.1111/jgs.16436 https://doi.org/10.1111/jgs.16436 PMid:32274807 PMCid:PMC7872739 |
||||
| 25.Stolz E, Hoogendijk EO, Mayerl H, Freidl W. Frailty changes predict mortality in 4 longitudinal studies of aging. J Gerontol A Biol Sci Med Sci 2021; 76: 1619-26. doi:10.1093/gerona/glaa266 https://doi.org/10.1093/gerona/glaa266 PMid:33103718 PMCid:PMC8361367 |
||||
| 26.Theou O, Pérez-Zepeda MU, van der Valk AM, Searle SD, Howlett SE, Rockwood K. A classification tree to assist with routine scoring of the Clinical Frailty Scale. Age Ageing 2021; 50: 1406-11. doi:10.1093/ageing/afab006 https://doi.org/10.1093/ageing/afab006 PMid:33605412 PMCid:PMC7929455 |
||||
| 27.Theou O, van der Valk AM, Godin J, Searle SD, McMillan M, Rockwood K, et al. Exploring clinically meaningful changes for the frailty index in a longitudinal cohort of hospitalized older patients. J Gerontol A Biol Sci Med Sci 2020; 75: 1928-34. doi:10.1093/gerona/glaa084 https://doi.org/10.1093/gerona/glaa084 PMid:32274501 PMCid:PMC7518565 |
||||
| 28.Zheng Q, Shao J, Teng J, Jin J, Abramov D, Verma A, et al. Frailty and its progression with cardiovascular disease risk across cardiovascular-kidney-metabolic syndrome stages 1 to 3. JACC Adv 2025; 102274. doi:10.1016/j.jacadv.2025.102274 https://doi.org/10.1016/j.jacadv.2025.102274 PMid:41165649 PMCid:PMC12805159 |
||||
| 29.Zimmer Z, Saito Y, Theou O, Haviva C, Rockwood K. Education, wealth, and duration of life expected in various degrees of frailty. Eur J Ageing 2021; 18: 393-404. doi:10.1007/s10433-021-00602-w https://doi.org/10.1007/s10433-020-00587-2 PMid:34483803 PMCid:PMC8377115 |
||||
| 30.Rolfson DB, Majumdar SR, Tsuyuki RT, Tahir A, Rockwood K. Validity and reliability of the Edmonton Frail Scale. Age and Ageing 2006; 35: 526-9. doi: 10.1093/ageing/afl041 https://doi.org/10.1093/ageing/afl041 PMid:16757522 PMCid:PMC5955195 |
||||
| 31.Kim DH, Rockwood K. Frailty in older adults. N Engl J Med 2024; 391: 538-48. doi: 10.1056/NEJMra2301292 https://doi.org/10.1056/NEJMra2301292 PMid:39115063 PMCid:PMC11634188 |
||||
| 32.Kim DH. Measuring frailty in health care databases for clinical care and research. Ann Geriatr Med Res 2020; 24: 62-74. doi:10.4235/agmr.20.0002 https://doi.org/10.4235/agmr.20.0002 PMid:32743326 PMCid:PMC7370795 |
||||
| 33.Clegg A, Young J, Iliffe S, Rikkert MO, Rockwood K. Frailty in elderly people. Lancet 2013; 381: 752-62. doi:10.1016/S0140-6736(12)62167-9 https://doi.org/10.1016/S0140-6736(12)62167-9 PMid:23395245 PMCid:PMC4098658 |
||||
| 34.Kim KJ, Shin J, Choi J, Won CW. Discrepancies in the prevalence of known frailty scales: Korean Frailty and Aging Cohort Study. Ann Geriatr Med Res 2018; 22: 137-44. doi:10.4235/agmr.2018.22.3.137 https://doi.org/10.4235/agmr.2018.22.3.137 PMid:32743263 PMCid:PMC7387589 |
||||
| 35.Hajek A, Bock JO, Saum KU, Matschinger H, Brenner H, Holleczek B, et al. Frailty and healthcare costs: longitudinal results of a prospective cohort study. Age Ageing 2018; 47: 233-41. doi:10.1093/ageing/afx170 https://doi.org/10.1093/ageing/afx170 PMid:29161361 |
||||
| 36.Hoogendijk EO, Afilalo J, Ensrud KE, Kowal P, Onder G, Fried LP. Frailty: implications for clinical practice and public health. Lancet 2019; 394: 1365-75. doi:10.1016/S0140-6736(19)31786-6 https://doi.org/10.1016/S0140-6736(19)31786-6 PMid:31609228 |
||||
| 37.Dent E, Martin FC, Bergman H, Woo J, Romero-Ortuno R, Walston JD. Management of frailty: opportunities, challenges, and future directions. Lancet 2019; 394: 1376-86. doi:10.1016/S0140-6736(19)31785-4 https://doi.org/10.1016/S0140-6736(19)31785-4 PMid:31609229 |
||||
| 38.Buta BJ, Walston JD, Godino JG, Park M, Kalyani RR, Xue QL, et al. Frailty assessment instruments: systematic characterization of the uses and contexts of highly cited instruments. Ageing Res Rev 2016; 26: 53-61. doi:10.1016/j.arr.2015.12.003 https://doi.org/10.1016/j.arr.2015.12.003 PMid:26674984 PMCid:PMC4806795 |
||||
| 39.Aguayo GA, Donneau AF, Vaillant MT, Schritz A, Franco OH, Stranges S, et al. Agreement between 35 published frailty scores in the general population. Am J Epidemiol 2017; 186: 420-34. doi:10.1093/aje/kwx061 https://doi.org/10.1093/aje/kwx061 PMid:28633404 PMCid:PMC5860330 |
||||
| 40.Theou O, Squires E, Mallery K, Lee JS, Fay S, Goldstein J, et al. What do we know about frailty in the acute care setting? A scoping review. BMC Geriatr 2018; 18: 139. doi:10.1186/s12877-018-0821-7 https://doi.org/10.1186/s12877-018-0823-2 PMid:29898673 PMCid:PMC6000922 |
||||
| 41.Dent E, Morley JE, Cruz-Jentoft AJ, Woodhouse L, Rodríguez-Mañas L, Fried LP, et al. Physical frailty: ICFSR international clinical practice guidelines for identification and management. J Nutr Health Aging 2019; 23: 771-87. doi:10.1007/s12603-019-1273-z https://doi.org/10.1007/s12603-019-1273-z PMid:31641726 PMCid:PMC6800406 |
||||
| 42.Morley JE, Malmstrom TK, Miller DK. A simple frailty questionnaire (FRAIL) predicts outcomes in middle-aged African Americans. J Nutr Health Aging 2012;16: 601-8. doi:10.1007/s12603-012-0084-2 https://doi.org/10.1007/s12603-012-0084-2 PMid:22836700 PMCid:PMC4515112 |
||||
| 43.Rolfson DB, Majumdar SR, Tsuyuki RT, Tahir A, Rockwood K. Validity and reliability of the Edmonton Frail Scale. Age Ageing 2006; 35: 526-9. doi:10.1093/ageing/afl041 https://doi.org/10.1093/ageing/afl041 PMid:16757522 PMCid:PMC5955195 |
||||
| 44.Walston J, Bandeen-Roche K, Buta B, Bergman H, Gill TM, Morley JE, et al. Moving frailty toward clinical practice: NIA intramural frailty science symposium summary. J Am Geriatr Soc 2019; 67: 1559-64. doi:10.1111/jgs.15928 https://doi.org/10.1111/jgs.15928 PMid:31045254 PMCid:PMC6830521 |
||||
| 45.Ruiz JG, Priyadarshni S, Rahaman Z, Cabrera K, Dang S, Valencia WM, et al. Validation of an automatically generated screening score for frailty: the Care Assessment Need (CAN) score. BMC Geriatr 2018; 18: 106. doi:10.1186/s12877-018-0791-9 https://doi.org/10.1186/s12877-018-0802-7 PMid:29728064 PMCid:PMC5935952 |
||||
| 46.Ruiz JG, Rahaman Z, Dang S, Anam R, Valencia WM, Mintzer MJ. Association of the CAN score with the FRAIL scale in community-dwelling older adults. Aging Clin Exp Res 2018; 30: 1241-5. doi:10.1007/s40520-018-0900-9 https://doi.org/10.1007/s40520-018-0910-4 PMid:29468614 |
||||
| 47.Clegg A, Bates C, Young J, Ryan R, Nichols L, Teale EA, et al. Development and validation of an electronic frailty index using routine primary care electronic health record data. Age Ageing 2016; 45: 353-60. doi:10.1093/ageing/afw039 https://doi.org/10.1093/ageing/afw039 PMid:26944937 PMCid:PMC4846793 |
||||
| 48.Gilbert T, Neuburger J, Kraindler J, Keeble E, Smith P, Ariti C, et al. Development and validation of a Hospital Frailty Risk Score focusing on older people in acute care settings using electronic hospital records: an observational study. Lancet 2018; 391: 1775-82. doi:10.1016/S0140-6736(18)30668-8 https://doi.org/10.1016/S0140-6736(18)30668-8 PMid:29706364 PMCid:PMC5946808 |
||||
| 49.Shi SM, Kim DH. The challenges of using the Hospital Frailty Risk Score. Lancet 2019; 392: 2692. doi:10.1016/S0140-6736(18)32714-8 https://doi.org/10.1016/S0140-6736(18)32426-7 PMid:30587360 |
||||
| 50.Segal JB, Chang HY, Du Y, Walston JD, Carlson MC, Varadhan R. Development of a claims-based frailty indicator anchored to a well-established frailty phenotype. Med Care 2017; 55: 716-22. doi:10.1097/MLR.0000000000000739 https://doi.org/10.1097/MLR.0000000000000739 PMid:28505042 |
||||
| 51.Kim DH, Schneeweiss S, Glynn RJ, Lipsitz LA, Rockwood K, Avorn J. Measuring frailty in Medicare data: development and validation of a claims-based frailty index. J Gerontol A Biol Sci Med Sci 2018; 73: 980-7. doi:10.1093/gerona/glx229 https://doi.org/10.1093/gerona/glx229 PMid:29244057 PMCid:PMC6001883 |
||||
| 52.Orkaby AR, Nussbaum L, Ho YL, Gagnon D, Quach L, Ward R, et al. The burden of frailty among US veterans and its association with mortality, 2002-2012. J Gerontol A Biol Sci Med Sci 2019; 74: 1257-64. doi:10.1093/gerona/gly229 https://doi.org/10.1093/gerona/gly229 PMid:30285092 |
||||
| 53.McIsaac DI, Wong CA, Huang A, Moloo H, van Walraven C. Derivation and validation of a generalizable preoperative frailty index using population-based health administrative data. Ann Surg 2019; 270: 102-8. doi:10.1097/SLA.0000000000002705 https://doi.org/10.1097/SLA.0000000000002705 PMid:29462005 PMCid:PMC9245892 |
||||
| 54.Segal JB, Huang J, Roth DL, Varadhan R. External validation of the claims-based frailty index in the National Health and Aging Trends Study cohort. Am J Epidemiol 2017; 186: 745-7. doi:10.1093/aje/kwx129 https://doi.org/10.1093/aje/kwx129 PMid:28520845 PMCid:PMC5860149 |
||||
| 55.Kim DH, Glynn RJ, Avorn J, Lipsitz LA, Rockwood K, Pawar A, et al. Validation of a claims-based frailty index against physical performance and adverse health outcomes in the Health and Retirement Study. J Gerontol A Biol Sci Med Sci.2019; 74: 1271-6. doi:10.1093/gerona/gly197 https://doi.org/10.1093/gerona/gly197 PMid:30165612 PMCid:PMC6625579 |
||||
| 56.Cuthbertson CC, Kucharska-Newton A, Faurot KR, Stürmer T, Jonsson Funk M, Palta P, et al. Controlling for frailty in pharmacoepidemiologic studies of older adults: validation of an existing Medicare claims-based algorithm. Epidemiology 2018; 29: 556-61. doi:10.1097/EDE.0000000000000841 https://doi.org/10.1097/EDE.0000000000000841 PMid:29629940 |
||||
| 57.Ambagtsheer RC, Beilby J, Dabravolskaj J, Abbasi M, Archibald MM, Dent E. Application of an electronic Frailty Index in Australian primary care: data quality and feasibility assessment. Aging Clin Exp Res 2019; 31: 653-60. doi:10.1007/s40520-018-1023-z 58.Kharrazi H, Anzaldi LJ, Hernandez L, Davison A, Boyd CM, Leff B, et al. The value of unstructured electronic health record data in geriatric syndrome case identification. J Am Geriatr Soc 2018; 66: 1499-507. doi:10.1111/jgs.15334 https://doi.org/10.1111/jgs.15334 PMid:29616500 PMCid:PMC6105548 |
||||
| 59.McIsaac DI, Bryson GL, van Walraven C. Association of frailty and 1-year postoperative mortality following major elective noncardiac surgery: a population-based cohort study. JAMA Surg 2016; 151: 538-45. doi:10.1001/jamasurg.2015.5085 https://doi.org/10.1001/jamasurg.2015.5085 PMid:26791334 |
||||
| 60.Hui Y, van Walraven C, McIsaac DI. How do common comorbidities modify the association of frailty with survival after elective noncardiac surgery? A population-based cohort study. Anesth Analg 2019; 129: 1699-706. doi:10.1213/ANE.0000000000003890 https://doi.org/10.1213/ANE.0000000000003890 PMid:30379679 |
||||
| 61.Street A, Maynou L, Conroy S. Did the Acute Frailty Network improve outcomes for older people living with frailty? A staggered difference-in-difference panel event study. BMJ Qual Saf 2023; 32: 721-31. doi:10.1136/bmjqs-2022-015677 https://doi.org/10.1136/bmjqs-2022-015832 PMid:37414555 |
||||
| 62.American Geriatrics Society Beers Criteria® Update Expert Panel. American Geriatrics Society 2023 updated AGS Beers Criteria® for potentially inappropriate medication use in older adults. J Am Geriatr Soc 2023; 71: 2052-81. doi:10.1111/jgs.18372 https://doi.org/10.1111/jgs.18372 PMid:37139824 PMCid:PMC12478568 |
||||
Copyright

This work is licensed under a Creative Commons Attribution-NonCommercial 4.0 International License.
AUTHOR'S CORNER
