Coronary plaque characteristics on CT Angiography: Associations with risk factors and stenosis burden
ORIGINAL RESEARCH ARTICLE
Coronary plaque characteristics on CT Angiography: Associations with risk factors and stenosis burden
Article Summary
- DOI: 10.24969/hvt.2026.650
- CARDIOVASCULAR DISEASES
- Published: 13/05/2026
- Received: 27/03/2026
- Revised: 01/05/2026
- Accepted: 01/05/2026
- Views: 562
- Downloads: 300
- Keywords: Multidetector computed tomography angiography, coronary artery disease, atherosclerotic plaques, coronary stenosis, cardiovascular risk factors, diagnostic accuracy
Address for Correspondence: Ahmed G. Bakry, Cardiology Division, Department of Internal Medicine, Faculty of Medicine, Qena University, Qena 83523, Egypt
Email: ahmedgbakry@gmail.com
ORCID: Ahmed G. Bakry-0000-0002-4581-4927; Saeda Mohamed Abd Elwahab – 0000-0003-1418-1917; Ashraf Alamir Abdelfattah – 0009-0004-9084-6110; Wafaa Ahmed Abdelwahab – 0009-0001-3392-6593
Facebook: Ahmed G. Bakry –@ahmed.bakry.1806, Saeda Mohamed Abd Elwahab – @sama.saeda, Ashraf Alamir Abdelfattah – @ashraf.alamir.9, Wafaa Ahmed Abdelwahab – @wafaa.gadelrab, Ghada Mohamed Abd ElRazik – @ghada.abdelrazek.554481
Twitter X: @AhmedGBakry
Saeda Mohamed Abd Elwahab1, Ashraf Alamir Abdelfattah2, Wafaa Ahmed Abdelwahab1, Ghada Mohamed Abd ElRazik1, Ahmed G. Bakry3
1Department of Diagnostic Radiology, Faculty of Medicine, Qena University, Qena 83523, Egypt
2Cardiology Department, Faculty of Medicine, Al Azhar University, Cairo 11884, Egypt
3Cardiology Division, Department of Internal Medicine, Faculty of Medicine, Qena University, Qena 83523, Egypt
Abstract
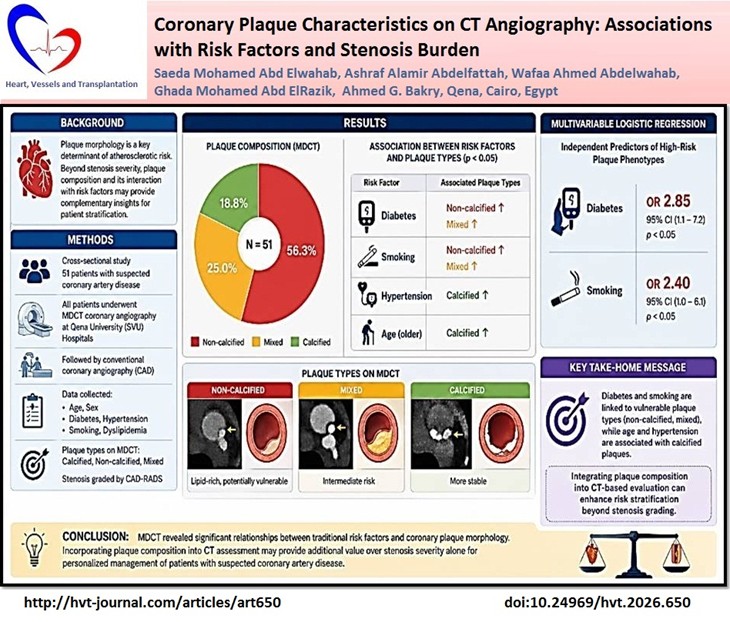
Objective: Coronary plaque morphology is a key determinant of atherosclerotic risk. While stenosis severity remains central to diagnosis, plaque composition and its interplay with clinical risk factors may provide complementary insights for patient stratification. This study aimed to evaluate the association between coronary plaque characteristics, traditional cardiovascular risk factors, and stenosis severity in patients undergoing multidetector computed tomography coronary imaging (MDCT).
Methods: In this cross-sectional study, 51 patients with suspected coronary artery disease (CAD) underwent MDCT at Qena University (SVU) Hospitals, followed by conventional coronary angiography (CCA). Plaques were categorized as calcified, non-calcified, or mixed. Clinical data included age, sex, diabetes, hypertension, smoking, and dyslipidemia were recorded. Stenosis severity was graded according to the CAD–Reporting and Data System (CAD-RADS). Associations were analyzed using Chi-square tests, correlation, and multivariable logistic regression.
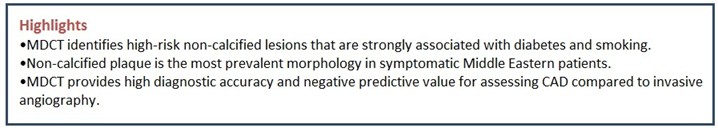
Results: Non-calcified plaques were most prevalent (56.3%), followed by mixed plaques (25%) and calcified plaques (18.8%). Diabetes and smoking correlated with the presence of non-calcified and mixed plaques (p<0.05), while calcified plaques predominated in hypertensive and older patients. In regression analysis, diabetes (OR 2.85, 95% CI 1.1–7.2) and smoking (OR 2.40, 95% CI 1.0–6.1) independently were associated with high-risk plaque phenotypes. MDCT showed excellent diagnostic performance for detection of significant CAD using CCA as gold standard with accuracy of 78.4% , sensitivity - 74.3%, specificity - 87.5%, positive predictive values - 92.9 %, and negative predictive value -60.9 %.
Conclusion MDCT revealed relationships between risk factors and plaque morphology. Diabetes and smoking were linked to vulnerable plaque types, while age and hypertension were associated with calcified lesions. Integrating plaque composition into CT-based evaluation may improve risk stratification beyond stenosis grading.
Key words: Multidetector computed tomography angiography, coronary artery disease, atherosclerotic plaques, coronary stenosis, cardiovascular risk factors, diagnostic accuracy
![]()
Introduction
Coronary artery disease (CAD) remains a leading cause of morbidity and mortality worldwide. While luminal stenosis has long been the cornerstone of diagnostic and therapeutic decisions, recent evidence highlights the importance of plaque composition as a determinant of prognosis (1). Non-calcified and mixed plaques, in particular, have been linked to increased vulnerability and a higher likelihood of future cardiovascular (CV) events compared with heavily calcified lesions (2).
Multidetector computed tomography (MDCT) allows comprehensive assessment of both coronary stenosis and plaque morphology. It provides a non-invasive means of identifying calcified, non-calcified, and mixed plaques, each reflecting different stages and biological behavior of atherosclerosis (3). Studies have demonstrated that high-risk features such as low attenuation and positive remodeling detected on computed tomography (CT) are strongly associated with subsequent acute coronary syndromes (4).
High-risk (vulnerable) plaque is defined on coronary CT angiography by specific imaging features associated with an increased likelihood of plaque rupture and adverse CV events. These features include low-attenuation plaque, positive remodeling, spotty calcifications, and the napkin-ring sign. The presence of these characteristics reflects underlying plaque instability and has been associated with future acute coronary syndromes (5).
The distribution of plaque types varies according to traditional CV risk factors. Diabetes, smoking, and dyslipidemia are particularly associated with non-calcified and mixed plaques, while hypertension and aging correlate more closely with calcified lesions (6). Understanding these associations is clinically relevant, as it allows risk stratification to move beyond luminal narrowing and incorporate the biological characteristics of atherosclerotic disease (7).
Although several studies have explored the prognostic role of plaque morphology in Western populations, data remain limited in Middle Eastern cohorts. Investigating the relationship between plaque composition, risk factor clustering, and stenosis severity in such populations may offer insights into regional differences in atherosclerotic disease expression (8).
Despite evidence from international studies, data on plaque morphology and its clinical correlates remain limited in Middle Eastern populations.
This study aimed to characterize coronary plaque composition with MDCT coronary imaging and evaluate its associations with clinical risk factors and stenosis severity confirmed by conventional coronary angiography (CCA).
Methods
Study design and population
Study setting and design: This investigation was designed as a hospital-based cross-sectional study and conducted at Qena university Hospitals, Egypt, from January 2024 to January 2025. Eligible patients were identified consecutively from cardiology outpatient and inpatient services during the study period. All participants underwent both MDCT angiography and CCA as part of their routine diagnostic work-up. The study is reported in accordance with the STROBE statement for observational research.
Study population: Eligibility Criteria: At Qena university Hospitals between January 2024 and January 2025, patients aged ≥18 years were enrolled based on clinical suspicion of CAD, including symptoms such as chest pain, dyspnea, or abnormal findings on initial clinical evaluation (e.g., electrocardiography (ECG) or risk assessment). Non-invasive testing such as stress testing was not uniformly performed, as MDCT was used as the primary imaging modality in the diagnostic pathway. CCA was considered the reference standard for confirming significant coronary stenosis when indicated.
Patients with prior bypass surgery or stenting, severe renal impairment (estimated glomerular filtration rate <30 mL/min/1.73 m²), contrast allergy, arrhythmias limiting CT acquisition, or hemodynamic instability were excluded.
Study Size Estimation: Sixty-four patients were screened over the study period. Thirteen were excluded because of prior revascularization, advanced renal disease, arrhythmias interfering with CT quality, or refusal to participate. The final study group consisted of 51 patients who underwent both MDCT coronary imaging and CCA. The planned sample size was 62, based on an expected 40% prevalence of significant stenosis, a 10% margin of error, and a 95% confidence level. Despite slightly lower recruitment, post-hoc analysis showed that the 51 patients provided more than 90% power to detect meaningful relationships between clinical risk factors, plaque composition, and stenosis severity.
Ethical Approval: The study was approved by the institutional ethics committee of SVU, and all patients gave written informed consent (Ethical approval code: SVU/MED/RAD/1/23/3/144). Procedures complied with the Declaration of Helsinki 2024.
Baseline variables
Age, sex, body mass index, blood pressure, and major CV risk factors (diabetes, hypertension, dyslipidemia, smoking) were documented. Fasting glucose and lipid profile were obtained for all patients.
MDCT coronary imaging
All coronary imaging was performed on a GE 128-slice MDCT scanner using routine departmental protocols. Patients with elevated resting heart rates (>65 beats/min) were pre-treated with oral or intravenous beta-blockers when not contraindicated. A sublingual nitrate (0.4 mg) was administered immediately before scanning to improve coronary vasodilatation. Non-ionic iodinated contrast (60–80 mL) was injected at 4–5 mL/s followed by a 40 mL saline chaser, with automated bolus tracking in the ascending aorta. Bolus tracking was performed with a region of interest (ROI) placed in the ascending aorta. Scanning was triggered once a predefined attenuation threshold (typically around 120–150 Hounsfield units) was reached. A short delay (approximately 5–7 seconds) was applied to optimize coronary enhancement. The scan duration was brief, typically within a single breath-hold (approximately 5–10 seconds), depending on heart rate and acquisition parameters.
Images were obtained in a single inspiratory breath-hold using prospective ECG gating. Radiation dose was minimized with tube current modulation and iterative reconstruction. Datasets were reconstructed at 0.6-mm slice thickness using a medium-sharp kernel.
Prospective ECG-gated acquisition at approximately 75% of the R–R interval was selected to reduce radiation exposure while maintaining optimal image quality. This phase corresponds to mid-to-late diastole, where coronary motion is minimal, particularly in patients with controlled heart rates. Retrospective ECG gating was not routinely used, as functional assessment was not required and prospective acquisition provided sufficient image quality for anatomical evaluation.
Analysis was performed on dedicated workstations. Coronary arteries were assessed according to the American Heart Association (AHA) 17-segment model (9). Each segment was evaluated for the presence of atherosclerotic plaque and classified into three categories:
• Calcified plaque: high-attenuation structures (>130 HU) without visible soft tissue components;
• Non-calcified plaque: low-attenuation material distinguishable from the lumen and surrounding tissue, without calcification;
• Mixed plaque: lesions containing both calcified and non-calcified components.
Segments with significant motion artifacts or poor opacification were excluded. To ensure reproducibility, two experienced cardiologists independently reviewed all scans. Interobserver variability for plaque type classification showed excellent agreement (Cohen’s κ = 0.85; 95% CI 0.78–0.92).5
Conventional coronary angiography
CCA was performed via radial or femoral access using standard Judkins catheters. Non-ionic contrast was injected, and each major vessel was imaged in at least two orthogonal projections, with extra views when needed for full assessment. Two independent cardiologists, blinded to CT results, evaluated stenosis severity. Significant narrowing was defined as ≥70% for major vessels and ≥50% for the left main coronary artery. Interobserver agreement was high (κ=0.88, 95% CI 0.81–0.95), with disagreements resolved by consensus (10).
Coronary artery calcium (CAC) scoring was used as a quantitative measure of calcified plaque burden and categorized according to standard Agatston score thresholds (11).
Stenosis severity was graded according to the Coronary Artery Disease–Reporting and Data System (CAD-RADS) (12).
Statistical analysis
All analyses were performed using SPSS version 26 (IBM Corp., Armonk, NY, USA). Continuous variables were checked for normality and are expressed as mean (standard deviation, SD) or median (interquartile range, IQR), while categorical data are presented as counts and percentages. Group comparisons were made using Chi-square or Fisher’s exact test for categorical variables and Kruskal-Wallis test for comparison of more than 2 groups continuous abnormally distributed data (posttest - Tukey test), as appropriate. Associations between plaque types, clinical risk factors, and stenosis severity were assessed using multivariable logistic regression (expressed as odds ratio, OR with 95% confidence interval (CI) and p value). Interobserver agreement for plaque classification was evaluated with Cohen’s kappa statistic. Receiver Operating Characteristic curve (ROC-curve) analysis: The overall diagnostic performance of each test was assessed by ROC curve analysis, a curve that extends from the lower left corner to the upper left corner then to the upper right corner is considered a perfect test. The area under the curve (AUC) evaluates the overall test performance (where the area under the curve >50% denotes acceptable performance and area about 100% is the best performance for the test). We calculated sensitivity, specificity, diagnostic accuracy, positive predictive (PPV) and negative predictive (NPV) values of test. A two tailed P value ≤ 0.05 was considered statistically significant.
Results
Baseline characteristics
This cross-sectional study involved 51 patients from Qena university Hospitals with CAD. The patients’ ages ranged from 35 to 77 years, with a mean age of 52.12 (8.49) years. Nearly two-thirds of patients were females (62.75%). Hypertension was present in 33.33%, diabetes mellitus in 49%, dyslipidemia in 52.9%, and 33.33% were current smokers. CCA revealed non-obstructive CAD in 31.37% and obstructive CAD (stenosis≥70%) in 68.63% of patients. Baseline demographic and clinical data are summarized in Table 1.
Distribution of coronary plaques by MDCT coronary imaging type
A total of 612 coronary segments were evaluated, of which 589 (96.2%) were diagnostic. Non-diagnostic segments were excluded due to motion artifacts or poor contrast opacification. Overall, non-calcified plaques were most prevalent (56.3%), followed by mixed plaques (25%) and calcified plaques (18.8%). The left anterior descending artery was the most commonly involved vessel (Table 2 and Fig. 1).
|
Table 1. Baseline characteristics of the study population (n= 51) |
|
|
Variables |
Value |
|
Age, years |
52.12 (8.49) |
|
Sex, n (%) |
|
|
Male |
19 (37.25) |
|
Female |
32 (62.75) |
|
Cardiovascular risk factors, n (%) |
|
|
Hypertension |
17 (33.33) |
|
Diabetes mellitus |
25 (49.0) |
|
Dyslipidemia |
27 (52.9) |
|
Current smoking |
17 (33.33) |
|
CCA data( non-obstructive coronary artery disease) |
16 (31.37) |
|
CCA data( obstructive coronary artery disease ≥70%) |
35 (68.63) |
|
Data are presented as mean (SD) or number (%) CCA – conventional coronary angiography |
|
|
Table 2. Distribution of coronary plaque types by vessel |
|||||
|
Coronary vessel |
Calcified (n-24), n (%) |
Non-calcified (n-72), n (%) |
Mixed (n-32), n (%) |
Total (n-128), n (%) |
*p |
|
Left main coronary artery (LMCA) |
2 (28.57) |
2 (28.57) |
3 (42.86) |
7 (5.47) |
0.074 |
|
Left anterior descending (LAD) |
17 (23.94) |
36 (50.70) |
18 (25.35) |
71 (55.47) |
|
|
Left circumflex (LCX) |
1 (4.54) |
13 (59.09) |
8 (36.36) |
22 (17.19) |
|
|
Right coronary artery (RCA) |
4 (14.28) |
21 (75.0) |
3 (10.71) |
28 (21.87) |
|
|
Values are presented as number (%). Chi-square test. Row percentages are shown for the distribution of plaque types within each vessel. The LAD was the most common site for all plaque types. LAD - Left anterior descending artery |
|||||
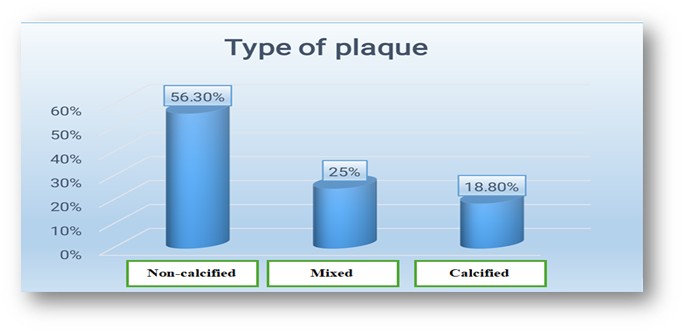
Figure 1. Distribution of coronary plaque composition on MDCT: non-calcified plaques were the most frequent type, followed by mixed and calcified plaques.
Plaque composition and clinical risk factors
Diabetes mellitus and smoking were significantly associated with higher frequencies of non-calcified and mixed plaques (p<0.05 for both). In contrast, calcified plaques were more frequently observed in hypertensive and older patients (p<0.05 for both). No significant sex-based differences in plaque type distribution were noted (Table 3).
Dyslipidemia showed no significant association with plaque composition.
|
Table 3. Association between risk factors and plaque composition |
||||
|
Risk Factor |
Non-Calcified (n-72), n (%) |
Mixed (n-32), n (%) |
Calcified (n-24), n (%) |
*p |
|
Hypertension |
10 (13.9) |
18 (56.3) |
22 (91.7) |
<0.05 |
|
Diabetes |
12 (16.7) |
16 (50.0) |
8 (33.3) |
<0.05 |
|
Smoking |
11 (15.3) |
14 (43.8) |
6 (25.0) |
<0.05 |
|
Age ≥60 years |
5 (6.9) |
9 (28.1) |
18 (75.0) |
<0.05 |
|
Dyslipidemia |
9 (12.5) |
13 (40.6) |
12 (50.0) |
0.21 |
|
Data are presented as n(%) Percentages represent the proportion of each plaque type within each risk factor category. *Chi-square test |
||||
Plaque composition and stenosis severity
A statistically significant association was found between plaque composition and the severity of coronary artery stenosis (p = 0.047). Mild stenosis (CAD-RADS 2) was observed only in patients with non-calcified plaques (6.9%), while no cases were reported in calcified or mixed plaques. Moderate stenosis (CAD-RADS 3) occurred in all plaque categories, most frequently in calcified plaques (33.3%), followed by mixed (25%) and non-calcified plaques (11.1%). Severe stenosis (CAD-RADS 4) represented the predominant category across all plaque types, affecting 66.7% of calcified, 70.8% of non-calcified, and 68.8% of mixed plaques. Total occlusion (CAD-RADS 5) was seen exclusively in non-calcified (11.1%) and mixed plaques (6.3%), with no cases detected in calcified plaques (Table 4).
|
Table 4. Association between plaque composition and stenosis severity |
||||
|
Stenosis severity (CAD-RADS) |
Calcified (n-24), n (%) |
Non-calcified (n-72), n (%) |
Mixed (n-32), n (%) |
*p |
|
CAD-RADS 2 |
0 (0) |
5 (6.9) |
0 (0) |
0.047 |
|
CAD-RADS 3 |
8 (33.3) |
8 (11.1) |
8 (25.0) |
|
|
CAD-RADS 4 |
16 (66.7) |
51 (70.8) |
22 (68.8) |
|
|
CAD-RADS 5 |
0 (0) |
8 (11.1) |
2 (6.3) |
|
|
Data are presented as n(%) *Chi-square test CAD-RADS – Coronary Artery Disease–Reporting and Data System |
||||
Calcium score and plaque composition
A statistically significant association was observed between plaque composition and coronary artery calcium (CAC) score (p<0.001). Patients with CAC = 0 were almost exclusively those with non-calcified plaques, accounting for 94.6%. In the CAC 1–99 categories, non-calcified plaques remained the most common (51.1%), followed by mixed plaques (31.1%) and calcified plaques (17.8%). Among patients with CAC 100–399, calcified plaques constituted the largest proportion (44%), with non-calcified and mixed plaques each representing 28%. In the highest category (CAC ≥400), mixed plaques predominated (42.9%), followed by non-calcified plaques (33.3%) and calcified plaques (23.8%). Overall, lower CAC scores were strongly linked to non-calcified plaque, whereas higher CAC scores were increasingly associated with calcified and mixed plaques. Calcified plaque was associated with a higher CAC score than non-calcified plaque (107 (68-203.75) vs. 4 (0-85), p = 0.028) (Table 5 and Fig. 2).
|
Table 5. Association of coronary artery calcium score with plaque composition |
|||||
|
CAC category |
Overall (n-128) |
Calcified (n=24) |
Non-calcified (n=72) |
Mixed (n=32) |
p |
|
n |
n (%) |
n (%) |
n (%) |
||
|
CAC 0 |
37 |
0 (0) |
35 (94.6) |
2 (5.4) |
<0.001† |
|
CAC 1–99 |
45 |
8 (17.8) |
23 (51.1) |
14 (31.1) |
|
|
CAC 100–399 |
25 |
11 (44.0) |
7 (28.0) |
7 (28.0) |
|
|
CAC ≥400 |
21 |
5 (23.8) |
7 (33.3) |
9 (42.9) |
|
|
CAC score, median (IQR) |
107.0 (68.0–203.8) § |
4.0 (0–85.0) §§ |
96.0 (36.0–457.0) |
<0.001‡ |
|
|
Data are presented as n (%) or median (IQR) †Chi-square test; ‡Kruskal-Wallis test. Post-hoc testing with Tukey correction: calcified vs. non-calcified § -p=0.028, non-calcified vs. mixed §§ - p=0.002 CAC – coronary artery calcium score |
|||||
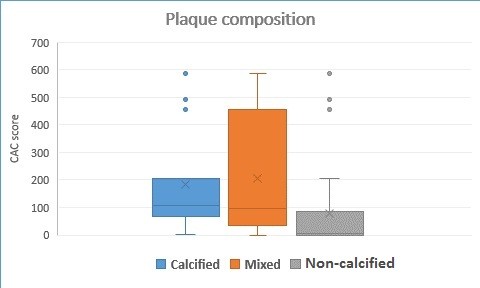
Figure 2. Boxplot showing CAC score distribution across plaque types. Higher CAC values were linked with mixed plaques, whereas non-calcified and calcific plaques were observed even at low CAC levels.
CAC – coronary artery calcium score
Multivariable predictors of high-risk plaques
On logistic regression analysis, diabetes (OR 2.85, 95% CI 1.1–7.2) and smoking (OR 2.40, 95% CI 1.0–6.1) predicted the presence of mixed or non-calcified plaques. Age and hypertension remained significant predictors of calcified plaques. Dyslipidemia was not independently associated with any single plaque type after adjustment for confounders (Table 6).
|
Table 6. Multivariable logistic regression for predictors of plaque type |
|||
|
Variables |
Odds Ratio |
95% Confidence Interval |
p |
|
Diabetes mellitus |
2.85 |
1.13 – 7.21 |
0.03 |
|
Current smoking |
2.40 |
1.01 – 6.11 |
0.04 |
|
Age (≥60 years) |
2.95 |
1.32 – 7.53 |
0.01 |
|
Hypertension |
2.10 |
1.01 – 5.62 |
0.04 |
|
Dyslipidemia |
1.20 |
0.82 – 2.34 |
0.32 |
Diagnostic accuracy of MDCT in prediction of significant coronary stenosis
MDCT coronary imaging showed excellent diagnostic performance for detection of significant CAD with accuracy of 78.4%, sensitivity 74.3%, specificity 87.5%, PPV 92.9%, and NPV 60.9% (Table 7).
|
Table 7. Diagnostic performance of MDCT coronary imaging for detection of significant stenosis using CCA as gold standard (per patient analysis) |
|||||
|
Accuracy |
Sensitivity |
Specificity |
PPV |
NPV |
p |
|
78.4% |
74.3% |
87.5% |
92.9% |
60.9% |
<0.001 |
|
CCA – conventional coronary angiography, MDCT – multidetector computed tomography, NPV - negative predictive value, PPV - positive predictive value |
|||||
Illustrative case examples
A representative case illustrating the correlation between MDCT angiography findings and CCA is shown in Figures 3-5. MDCT with curved multiplanar reformation demonstrated a concentric non-calcified plaque in the mid left anterior descending artery (LAD) causing severe to near-total luminal narrowing. Additional non-calcified plaques were identified in the proximal left circumflex artery (LCX) and along the proximal-to-mid segment of the right coronary artery (RCA), both producing severe stenosis. Subsequent CCA confirmed the presence of severe obstructive disease in the corresponding segments, including a severe stenotic lesion in the mid LAD, severe stenosis of the proximal LCX, and a long chronic subtotal occlusion of the proximal-to-mid RCA. Three-dimensional volume-rendered CT images further illustrated the extent of luminal compromise and spatial distribution of the lesions. These findings demonstrate the capability of MDCT to accurately depict plaque morphology and the degree of luminal stenosis in agreement with invasive angiography.
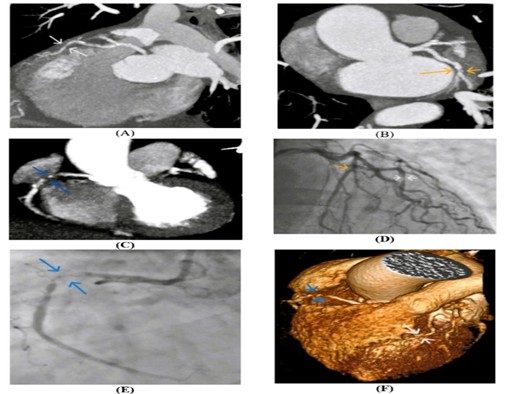
Figure 3. Representative case demonstrating correlation between MDCT angiography and CCA. Curved Multi Planner Reformated (MPR) CT coronary angiography shows: (A) a mid LAD concentric non-calcified plaque causing severe to near-total occlusion (white arrow); (B) a proximal LCX concentric non-calcified plaque causing severe stenosis (yellow arrow); and (C) a proximal-to-mid RCA lesion causing severe to near-total occlusion (blue arrow). CCA demonstrates (D) mid LAD - severe stenotic lesion (white arrow), proximal LCX - severe stenotic lesion (yellow arrow), and (E) proximal-to-mid RCA - long chronic subtotal occlusion (blue arrow). The 3D volume rendered (VR) CT coronary angiography confirms (F) mid LAD - severe to near-total occlusion (white arrow) and proximal-to-mid RCA severe to near-total occlusion (blue arrow).
CCA- conventional coronary angiography, CT – computed tomography, LAD – left anterior descending coronary artery, LCX- left circumflex artery, MDCT - multidetector CT, RCA- right coronary artery
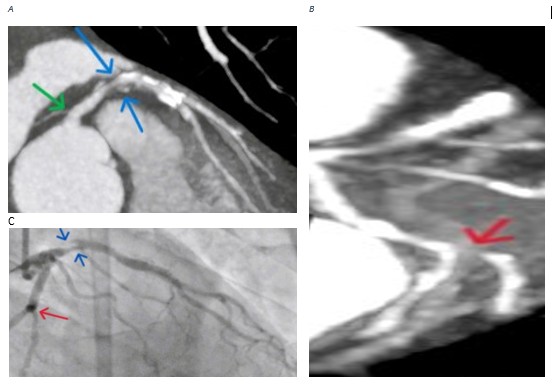
Figure 4. Representative case demonstrating correlation between MDCT angiography and CCA – analysis of left coronary arterial system: (A) curved MPR CT coronary angiography revealed: LMCA - mild stenosis
(green arrow), LAD - proximal severe stenosis, mixed plaque with positive remodeling (blue arrow); (B) curved MPR CT coronary angiography revealed: LCX - severe stenosis of obtuse marginal 1 ostial branch (red arrow) and (C) CCA revealed: LAD - proximal severe stenosis (blue arrow), and obtuse marginal 1 mild stenotic insignificant lesion (red arrow).
CCA- conventional coronary angiography, CT – computed tomography, LAD – left anterior descending coronary artery, LCX- left circumflex artery, LMCA – left main coronary artery, MDCT - multidetector CT, MPR – multiplanar reformated
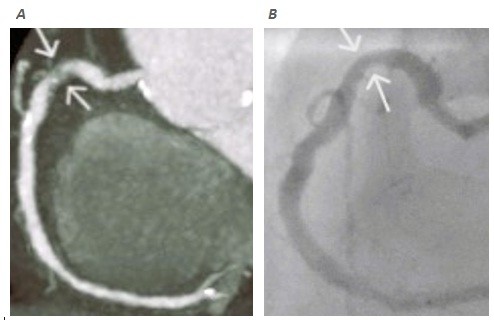
Figure 5. Representative case demonstrating correlation between MDCT angiography and CCA – analysis of RCA system: (A) curved MPR CT coronary angiography revealed severe stenotic lesion of proximal RCA (white arrow); (B ) CCA revealed mild stenotic insignificant RCA lesion (white arrow).
CCA- conventional coronary angiography, CT – computed tomography, artery, MDCT - multidetector CT, MPR – multiplanar reformatted, RCA – right coronary artery
Discussion
This study analyzed coronary plaque composition and its clinical associations in a Middle Eastern cohort evaluated by MDCT coronary imaging. Non-calcified plaques were most prevalent (56.3%), followed by mixed plaques (25%) and calcified plaques (18.8%). These findings highlight that plaque morphology provides incremental information beyond stenosis assessment and may refine prognostic evaluation in suspected CAD. The use of MDCT allowed reliable plaque characterization and correlation with CCA, reflecting the modality’s role in non-invasive atherosclerosis profiling.
The predominance of non-calcified plaques and mixed plaques align with international data showing these lesions as transitional forms with higher inflammatory activity and rupture potential. A recent meta-analysis confirmed that mixed and non-calcified plaques on CT imaging are more frequently associated with lesion-specific ischemia, independent of luminal narrowing (13). This agrees with our observation that severe stenosis (CAD-RADS 4) represented the predominant category across all plaque types, more affecting 70.8% of non-calcified plaque, 68.8% of mixed plaques and 66.7% of calcified plaques.
Diabetes was a strong independent predictor of high-risk plaque types (OR 2.85, 95% CI 1.1–7.2). Chronic hyperglycemia promotes endothelial injury and lipid oxidation, accelerating non-calcified and mixed plaque formation. The high prevalence of diabetes in the Middle East magnifies its cardiovascular impact. The PACT-MEA study reported that over 40% of adults in the region have diabetes or prediabetes, with markedly increased CV events (14). Our findings support these epidemiological data by demonstrating that diabetes promotes vulnerable plaque morphologies even in moderate stenosis grades.
Smoking also independently predicted non-calcified and mixed plaques (OR 2.40, 95% CI 1.0–6.1). The association likely reflects smoking-induced oxidative stress and inflammation, which destabilize plaque composition. Prior work using CT imaging in diabetic patients confirmed that smokers exhibit higher non-calcified plaque volumes and greater overall plaque burden (15). Similarly, a national registry from Jordan found that combined smoking and diabetes worsened coronary lesion severity and outcomes after percutaneous intervention (16). Our cohort reflects this pattern, reinforcing the need for aggressive smoking control in high-risk populations.
Age and hypertension were mainly linked to calcified plaques, consistent with long-term arterial remodeling and mineralization. These stable plaque phenotypes have been described in hypertensive patients, where CT imaging shows larger calcified volumes and fewer vulnerable features (17). The predominance of calcified lesions in older hypertensive patients in our study supports this established relationship and indicates chronic disease stability rather than acute vulnerability.
Dyslipidemia, though frequent, was not an independent predictor of plaque type after adjustment. This may relate to confounding effects of diabetes or small sample size. Nevertheless, dyslipidemia contributes to total plaque burden. Quantitative CT imaging in young adults recently confirmed that lipid abnormalities are associated with increased overall plaque volume but not always with composition type (18, 19)
The observed correlation between plaque morphology and angiographic stenosis severity strengthens the clinical value of MDCT. Mixed plaques and non-calcified plaques corresponded to more severe narrowing on CCA, showing the ability of CT imaging to mirror invasive findings. Current recommendations advocate integrating plaque composition with stenosis assessment for better functional and prognostic interpretation. Emerging evidence supports CT-based plaque quantification enhanced by artificial intelligence for individualized risk stratification (19). Our results are consistent with this approach and highlight the diagnostic synergy between non-invasive and invasive imaging.
Analysis of CAC scores showed that mixed plaques predominated at higher CAC categories, while non-calcified and calcific types persisted even at low or intermediate calcium levels. This illustrates CAC’s limitation as a sole marker of atherosclerotic activity. A recent review emphasized that quantitative plaque evaluation outperforms CAC alone in predicting outcomes and should be considered for comprehensive risk assessment (20). In our population, reliance on CAC alone would have underestimated risk in several patients with vulnerable plaque morphology.
In this context, Wang et al. (21) reported that the CAC score categories was 0 in 11.4%, 1–9 in 6.2%, 10–99 in 20%, 100–399 in 24.5%, 400– 999 in 20.5% and ≥1000 in 17.5% in patients older than 75 years old who do not have any signs of CAD.
Considering this, Hashmi et al. (22) reported that CAC score was 0- 9 in 86.4% in healthy people, 48.7% in mild CAD, 11.8% in moderate CAD and 2.0% in severe CAD, calcium score was 10–99 in 9.1% of healthy people, 46.1% in mild CAD, 55.9% in moderate CAD and 32.0% in severe CAD and CAC score was 100–400 in 4.5% in healthy people, 5.2% in mild CAD, 32.3% in 65.0% in cases of severe CAD and mild CAD.
Nevertheless, García et al. (23) in a study of 276 patients with acute coronary syndrome without ST-segment reported that the median CAC score was 221 AU.
This study contributes to region-specific data where CAD patterns may differ due to the high prevalence of diabetes and smoking. The combination of MDCT coronary imaging and CCA ensured validation of imaging findings and provided insight into plaque behavior in an underrepresented population.
Cardiovascular disease patterns in Middle Eastern populations differ in several important aspects from Western cohorts. The region is characterized by a markedly higher prevalence of diabetes, earlier onset of metabolic syndrome, and increasing rates of smoking, all of which contribute to accelerated and more aggressive atherosclerosis (14). These factors are strongly linked to the development of non-calcified and mixed plaques, which are considered more vulnerable and prone to rupture. In contrast, Western populations tend to present at older ages with a higher burden of calcified plaques, reflecting more chronic and stabilized disease processes (17).
Our findings align with this pattern, as diabetes and smoking were independently associated with non-calcified and mixed plaque phenotypes in our cohort. This suggests that CAD in Middle Eastern patients may manifest with more active and high-risk plaque characteristics at relatively earlier stages, highlighting the need for earlier detection and more aggressive preventive strategies in this population.
Study limitations
However, several limitations should be recognized. The cross-sectional design prevents causal inference, and the modest sample size limits generalizability. The cohort is comprised of symptomatic patients that may over-represent severe disease. Moreover, advanced features such as positive remodeling or ``napkin-ring`` sign were not included. Larger longitudinal studies incorporating artificial intelligence-based plaque analysis could clarify the prognostic significance of these features in Middle Eastern cohorts.
This study demonstrates that plaque composition on MDCT provides valuable information about CAD severity and risk factor associations. Diabetes and smoking independently predicted vulnerable plaque types, while age and hypertension were linked to calcified, likely stable, lesions. Integrating plaque morphology into CT-based assessments can enhance risk stratification and guide preventive strategies tailored to regional cardiovascular profiles.
Conclusion
Multidetector CT coronary imaging revealed clear patterns between plaque composition, clinical risk factors, and disease severity. Mixed and non-calcified plaques, common in patients with diabetes and smoking history, signaled more active and high-risk disease, while calcified plaques in older hypertensive patients reflected more stable remodeling. Considering plaque characteristics alongside stenosis and calcium scoring may strengthen risk assessment and guide earlier, more targeted prevention in vulnerable groups.
Ethics: The study was approved by the institutional ethics committee of SVU, and all patients gave written informed consent (Ethical approval code: SVU/MED/RAD/1/23/3/144). Procedures complied with the Declaration of Helsinki 2024.
Peer-review: External and internal
Conflict of interest: None to declare
Authorship: W.A.A., A.A.A. and S.M.A. conceived the study. W.A.A., A.G.B. and G.A.A. collected and analyzed the data. W.A.A. and A.G.B. drafted the manuscript. All authors revised and agreed the final version, thus fulfilled authorship criteria.
Acknowledgements and Funding: None to declare.
Statement on A.I.-assisted technologies use: Authors used artificial intelligence (A.I.) tools for preparation graphical abstract.
Data and material availability: Contact authors, any sharing should in frame of fair use an collaboration with acknowledgement of source.
References
| 1. Buonpane A, De Caterina AR, Trimarchi G, Di Muro FM, Galante D, Zella S, et al. Unveiling the causes of acute and non-acute myocardial ischemic syndromes: The role of optical coherence tomography. Medicina 2025; 61: 1218-52. https://doi.org/10.3390/medicina61071218 PMid:40731847 PMCid:PMC12299103 |
||||
| 2. Alhammouri H, Ibrahim R, Alasmar R, Abdelnabi M, Habib E, Allam M, et al. Computed tomography and coronary plaque analysis. Tomography 2025; 11: 512-23. https://doi.org/10.3390/tomography11080085 PMid:40863876 PMCid:PMC12389945 |
||||
| 3. Tayyem M, Cakir O, Acar B, Yalnız A, Ciftci E. Comparative analysis of plaque morphology in coronary and carotid arteries with multidetector computed tomography angiography. Postepy Kardiol Interwencyjnej 2025; 21: 526-33. https://doi.org/10.5114/aic.2025.156709 PMid:41743769 PMCid:PMC12931120 |
||||
| 4. Gać P, Jakubowska-Martyniuk A, Żórawik A, Hajdusianek W, Żytkowski D, Matys T, et al. Diagnostic methods of atherosclerotic plaque and the assessment of its prognostic significance-A narrative review. J Cardiovasc Dev Dis 2024; 11: 343-8. https://doi.org/10.3390/jcdd11110343 PMid:39590186 PMCid:PMC11594366 |
||||
| 5. Dawson LP, Layland J. High-risk coronary plaque features: A narrative review. Cardiol Ther 2022; 11: 319-35. https://doi.org/10.1007/s40119-022-00271-9 PMid:35731471 PMCid:PMC9381667 |
||||
| 6. Verboova L, Nedoroscik A, Kiskova-Simkova T, Smirjakova A, Bohus P, Kollar M, et al. Atherosclerosis: A pathologist's perspective. J Cardiovasc Dev Dis 2026; 13: 85-95. https://doi.org/10.3390/jcdd13020085 PMid:41745332 PMCid:PMC12942517 |
||||
| 7. He Z, Luo J, Lv M, Li Q, Ke W, Niu X, et al. Characteristics and evaluation of atherosclerotic plaques: an overview of state-of-the-art techniques. Front Neurol 2023; 14: 115-29. https://doi.org/10.3389/fneur.2023.1159288 PMid:37900593 PMCid:PMC10603250 |
||||
| 8. Cyréus P, Wadén K, Hellberg S, Bergman O, Lengquist M, Karlöf E, et al. Atherosclerotic plaque instability in symptomatic non-significant carotid stenoses. JVS Vasc Sci 2025; 6: 100-20. https://doi.org/10.1016/j.jvssci.2025.100280 https://doi.org/10.1016/j.jvs.2025.01.229 |
||||
| 9. Talaat M, Kharabish A, Homos MD, Fouad M, Nabil DM. The coronary arterial anatomy of the 17-segment model using 3-Tesla cardiac magnetic resonance imaging. Egypt J Radiol Nucl Med 2016; 47: 1303-11. https://doi.org/10.1016/j.ejrnm.2016.06.021 |
||||
| 10. Neumann F-J, Sousa-Uva M, Ahlsson A, Alfonso F, Banning AP, Benedetto U, et al. 2018 ESC/EACTS Guidelines on myocardial revascularization. Eur Heart J 2019; 40: 87-165. https://doi.org/10.1093/eurheartj/ehy394 PMid:30165437 |
||||
| 11. Manubolu VS, Dahal S, Lakshmanan S, Crabtree T, Kinninger A, Shafter AM, et al. Comparison of coronary artery calcium and quantitative coronary plaque in predicting obstructive coronary artery disease: Subgroup analysis of the clarify study. Heart Int 2024; 18: 44-50. https://doi.org/10.17925/HI.2024.18.1.7 PMid:39006468 PMCid:PMC11239135 |
||||
| 12. Cury RC, Leipsic J, Abbara S, Achenbach S, Berman D, Bittencourt M, et al. CAD-RADS 2.0 - 2022 Coronary Artery Disease-Reporting and Data System: An Expert Consensus Document of the Society of Cardiovascular Computed Tomography (SCCT), the American College of Cardiology (ACC), the American College of Radiology (ACR), and the North America Society of Cardiovascular Imaging (NASCI). J Cardiovasc Comput Tomogr 2022; 16: 536-57. https://doi.org/10.1016/j.jcct.2022.07.002 PMid:35864070 |
||||
| 13. Iraqi N, Nørgaard BL, Dey D, Abdulla J. Influence of plaque characteristics by coronary computed tomography angiography on lesion-specific ischemia: a systematic review and meta-analysis. Eur Radiol 2025; 35: 6271-90. https://doi.org/10.1007/s00330-025-11516-1 PMid:40146424 PMCid:PMC12417243 |
||||
| 14. Verma S, Alamuddin N, Alawadi F, Alkandari H, Almahmeed W, Assaad-Khalil SH, et al. Prevalence of diabetes and cardiovascular risk in the Middle East and Africa: primary results of the PACT-MEA study. Circulation 2023; 147: 1251-5. https://doi.org/10.1161/CIRCULATIONAHA.123.064345 PMid:36877670 PMCid:PMC10101130 |
||||
| 15. Jiang Y, Pang T, Shi R, Qian W-l, Yan W-f, Li Y, et al. Effect of smoking on coronary artery plaques in type 2 diabetes mellitus: Evaluation with coronary computed tomography angiography. Front Endocrinol 2021; 12750773. https://doi.org/10.3389/fendo.2021.750773 PMid:34803915 PMCid:PMC8595938 |
||||
| 16. Jarrah MI, Al-Khatib S, Khader Y, AlKharabsheh HN, Hammoudeh A, Alzoubi KH, et al. The impact of coexistence of smoking and diabetes on the coronary artery severity and outcomes following percutaneous coronary intervention: results from the 1ST Jordanian PCI Registry. Int J Vasc Med 2020; 2020: 7624158. https://doi.org/10.1155/2020/7624158 PMid:32695516 PMCid:PMC7352136 |
||||
| 17. Lorenzatti D, Piña P, Huang D, Apple SJ, Fernandez-Hazim C, Ippolito P, et al. Interaction between risk factors, coronary calcium, and CCTA plaque characteristics in patients aged 18-45 years. Eur Heart J Cardiovasc Imaging 2024; 25: 1071-82. https://doi.org/10.1093/ehjci/jeae094 PMid:38578944 |
||||
| 18. Berberich AJ, Hegele RA. A Modern approach to dyslipidemia. Endocr Rev 2022; 43: 611-53. https://doi.org/10.1210/endrev/bnab037 PMid:34676866 PMCid:PMC9277652 |
||||
| 19. Lorenzatti D, Piña P, Huang D, Apple SJ, Fernandez-Hazim C, Ippolito P, et al. Interaction between risk factors, coronary calcium, and CCTA plaque characteristics in patients aged 18-45 years. Eur Heart J-Cardiovasc Imag 2024; 25: 1071-82. https://doi.org/10.1093/ehjci/jeae094 PMid:38578944 |
||||
| 20. Vatsa N, Faaborg-Andersen C, Dong T, Blaha MJ, Shaw LJ, Quintana RA. Coronary atherosclerotic plaque burden assessment by computed tomography and its clinical implications. Circ Cardiovascular Imaging 2024; 17: e016443. https://doi.org/10.1161/CIRCIMAGING.123.016443 PMid:39163370 PMCid:PMC11566462 |
||||
| 21. Wang FM, Cainzos-Achirica M, Ballew SH, Coresh J, Folsom AR, Howard CM, et al. Defining demographic-specific coronary artery calcium percentiles in the population aged ≥75: The ARIC Study and MESA. Circ Cardiovasc Imaging 2023; 16: 151-245. https://doi.org/10.1161/CIRCIMAGING.122.015145 PMid:37655462 PMCid:PMC10721116 |
||||
| 22. Hashmi KA, Akhtar A, Masood F, Maqbool S, Kabeer HMA, Ahmed J. Coronary artery stenosis severity in patients with different coronary artery calcium scores on coronary computed tomography angiography. Cureus 2023; 15: 394-461. https://doi.org/10.7759/cureus.39461 PMid:37362463 PMCid:PMC10290215 |
||||
| 23. García SDC, Gárriz II, Coloma CG, Manso JV, Fernández JFC, Rodríguez DA, et al. Coronary artery calcium score in patients with non-ST-segment elevation acute coronary syndrome. CardioClinics 2025; 60: 167-75. https://doi.org/10.1016/j.rccl.2025.02.002 |
||||
Copyright

This work is licensed under a Creative Commons Attribution-NonCommercial 4.0 International License.
AUTHOR'S CORNER
